Hello everyone,
I'm a student and new here.
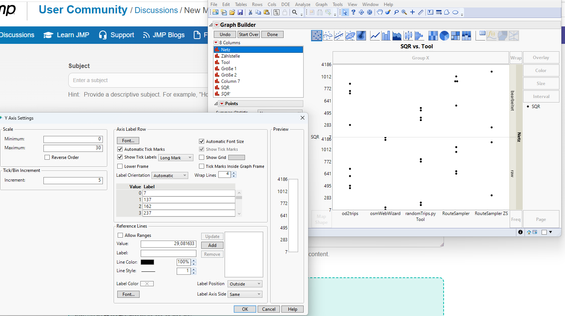
I want to plot points in the graph builder. Unfortunaly I'm not able to change the y axis to a linear scale, like i would get it if I plot it in word for example.
What I mean is, I want 500, 1000, 1500,... for the labels instead there are the values of the data points I plot
Here is how it looks like:
Thanks in advance
Flo
Try changing your modelling type to Continuous instead of Nominal. In JMP correct modelling type (and data type) do matter a lot. You can do this by right-clicking on the red bar chart next to column name. If continuous is disabled your data isn't numeric data and you have to first fix that (example of this below)

