Data extraction from PDF files
I sometimes analyze published data, and sometimes I want a table in a PDF file to be a data table. In particular, the data published by government offices, etc., is surprisingly often embedded as a table in a PDF file, not in Excel or csv format.
At that time, until 4 or 5 years ago, I used to select and copy the corresponding table on the PDF file and paste it into Excel or JMP, but there are many cases where it is not properly recognized as data, and in the worst case Sometimes I gave up and created data manually.
At that time, JMP version 15 added The "PDF Import Wizard" was gospel for me. Data creation from PDF, which used to take time, can now be done in a few seconds! ! This frees up time for deep analysis of the data.
last time i wrote Blog post (Gender Gap Index) quoted a table in a PDF report, but without the function of the PDF import wizard, creating the data would have been troublesome and frustrating.
Therefore, in this blog, I will introduce the amazing part of "PDF Import Wizard". Even if you are already using this function, there may be things you don't know, so please read it.
What you can do with the PDF Import Wizard
"PDF Import Wizard" is a function that adjusts the data to be read while referring to the preview before reading the PDF file.
Select [File] > [Open] from the JMP menu bar, and select the PDF file to load to automatically launch the "PDF Import Wizard" (*1).

A preview is displayed on the left side of the wizard as shown above. It automatically recognizes the tables in the PDF and displays the recognized ones in the "Table preview" on the right.
Check if the table you want to read is recognized here, and if there is no problem, click the [OK] button to open it as a JMP data table.

In this example, we can easily load the experimental data given in the paper.
After this, I will pick up two amazing points along with actual examples and introduce them.
Amazing part 1: Automatically concatenates tables with the same column name into one
The following is a PDF of the statistics on the employment status of general national public servants published by the Cabinet Secretariat (*2). From this table, we want to create a JMP data table for the number of part-time employees in each ministry, year-on-year change (persons), and year-on-year change (%).

The ability to automatically recognize tables in a PDF can be useful, but in practice, it is rare to read all the tables in a PDF, and there are many cases where you want to read only specific tables.
In such a case, at the top right of the wizard, Ignore All Tables Click the button to cancel automatic selection.
After that, move to the page with the table you want to read in the preview on the left, and click the red triangle button on the upper left of the page. [Auto detect this page] to auto-detect only the tables on that page.

However, there are some tables that the auto-detection does not work well. In that case, drag the place you want to make a table to create a rectangle, and the table inside the rectangular frame will be recognized. In practice, this method of selecting tables by dragging is convenient.

After selecting the relevant table, on the right side of the preview "Concatenate tables with matching column names" , and click the [OK] button.

Then, the tables that were displayed separately in two will be read together into one table.
Normally, two tables would be loaded, and then you would have to combine the tables into one using [Concatenate], which this wizard does for you.
Therefore, by slightly modifying the created data table, we were able to create histograms of the number of employees, year-on-year changes, and year-on-year changes, and investigate outlier ministries and agencies.

Amazing part 2: Concatenates multiple pages of tables into one
This PDF file shows the results of the ski jumping team competition by country (*3). The results from 1st to 8th place are shown, but they are not contained in one page but spread over two pages. Although it is in a table format by country, I would like to combine these tables into one table.

You are previewing this PDF. Select the target table and "Concatenate all tables into one" and click the [OK] button.
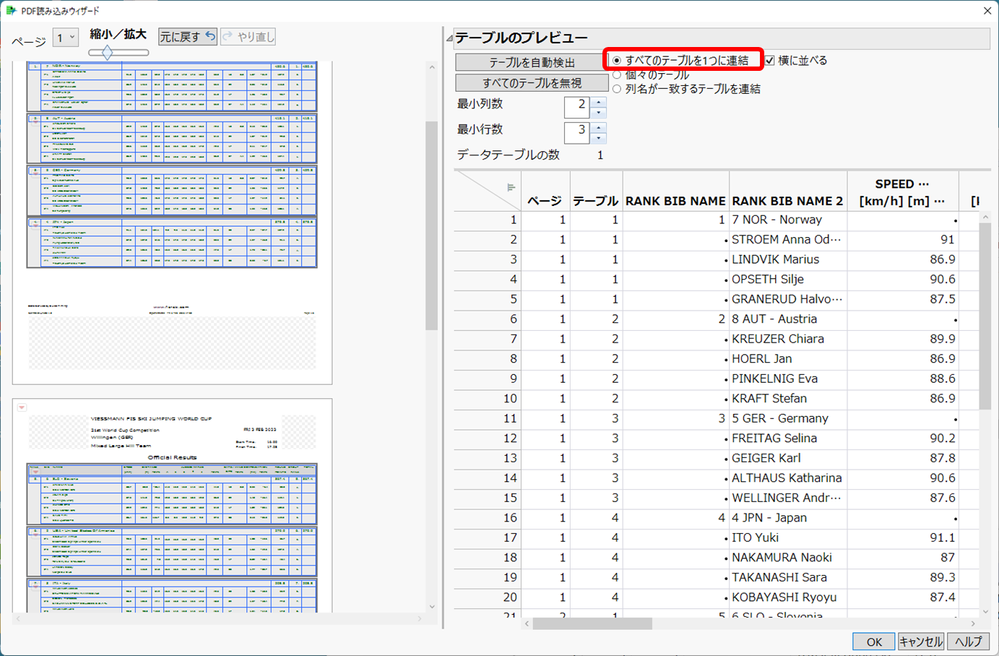
It loads multiple tables into one. Unlike the previous example, the PDF file used here has tables that do not have column names, so I used "Concatenate all tables into one".
After this, some data processing is required, but I was able to create score plots for each team (for 4 players) without spending too much time. It's interesting to see that there are teams with 4 players that score scatter and teams that don't.

We will continue to make full use of this wonderful function and work hard on data analysis! !
by Naohiro Masukawa (JMP Japan)
PDF file citation
*1 : Rational design of a scalable bioprocess platform for bacterial cellulose production
https://www.sciencedirect.com/science/article/abs/pii/S0144861718312839
*2: Cabinet Secretariat Statistics Table of Employment Status of National Public Servants
https://www.cas.go.jp/jp/gaiyou/jimu/jinjikyoku/files/20220701_toukeihyou_gaiyou.pdf
*3: FIS SKI JUMPING WORLD CUP Official Results
https://medias2.fis-ski.com/pdf/2023/JP/3093/2023JP3093RL.pdf
