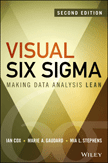
 Do you want to discover new and useful knowledge in your data using interactive, dynamic graphical displays? Would you like to be able to make sound decisions faster by understanding the patterns of variation in your data and separating it into useful signal and random noise? You can, with the help of Visual Six Sigma: Making Data Analysis Lean, Second Edition!
What is Visual Six Sigma?
It is "a practical and pragmatic approach to data analysis and process improvement.... In the typical business environment of process improvement, people are looking for simple-to-use tools that can be used by everyone at all levels to rapidly explore and interpret data, and then use that understanding to drive improvement. By making these tools highly visual and engaging, we can accelerate the process of analysis and eliminate the need for advanced statistical analysis in all but the most complex of situation," wrote Andrew Ruddick, Andy Liddle and Malcolm Moore in a 2008 white paper.
Using the principles, concepts and detailed road map outlined in the book Visual Six Sigma – along with JMP – you can broaden and deepen data analysis and process improvement in your organization by making the tools intuitive and easy to use. Plus, the results are easy to interpret! You will be able to quickly see the important and useful patterns in your data – enabling you to improve processes, connect with customer needs and expectations, react to emerging market trends, and seize opportunities for growth.
This second edition incorporates ways to take advantage of developments that make the implementation of Visual Six Sigma even easier, further increasing the scope and efficiency of its application. The book was updated using JMP 12.2.0 (with detailed instructions and illustrative screenshots demonstrating the latest functionalities in JMP and JMP Pro). It also includes two new chapters: "Managing Data and Data Quality" and "Beyond 'Point and Click' with JMP."
Visual Six Sigma is a powerful way to help you focus on the relevant and important data you have and to use this data effectively. According to Ruddick, Liddle and Moore, visual approaches facilitate rapid exploration of the data to quickly find the " 'hot Xs,' the process inputs responsible for driving variation in product quality or associated with variation in product quality."
Now for some fun…
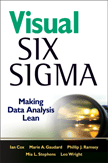 If you are among the first seven people to comment on this blog post describing your strategies for making data analysis lean in your organization, you could win a hardcover copy of Visual Six Sigma: Making Data Analysis Lean. (This is the first edition of the book – only seven of them are left!)
Be sure to enter your e-mail address when you write your comment so we can contact you if you are a winner. Only one book per commenter and for U.S. addresses only.
In addition, SAS is turning 40, and we're celebrating you, our users! Every Friday in July, we'll feature a special offer for SAS and JMP users. The discounts include specials on training, certification, books and SAS events.
How do you get these rewards?
Follow us on Twitter
@SASSoftware or
Facebook.
Watch these social channels each Friday in July to see the special offers.


