I shared in my previous post that I scoured my baby book and tracking notebooks and requested various medical records to gather historical information about my weight fluctuations over the years. I used this data to construct JMP graphs with annotations and pinned hover labels containing pictures (thanks to the new expression columns feature in JMP 12).
The process of creating and exploring these graphs gave me a lot of insight into how stress-related overeating patterns contributed to my past weight gains. I also rediscovered that self-tracking was an essential component to all of my successful weight loss and maintenance efforts since college.

I tracked during all of my successful weight loss efforts (annotations in blue), but things often went in the other direction when I wasn't tracking (annotations in red).
I collected weight data because it was easy to do at home. But excess weight is one of several major independent risk factors for heart disease. With the 13thWear Red Day approaching on Feb. 5, it’s a perfect time to recall that heart disease is the No. 1 killer of women in the US and revisit the American Heart Association website to learn more about weight and the other risk factors that contribute to heart disease. Wear Red Day helps raise awareness that the majority of heart disease deaths can be prevented by adopting lifestyle changes like losing weight, getting regular exercise, and improving eating habits. Discussing your lifestyle factors, family history, and current blood pressure and cholesterol numbers with your doctor can be a helpful step in understanding your own personal risks.
Experts generally agree that carrying excess weight stresses the cardiovascular system directly and has a negative impact on risk biomarkers like blood pressure and cholesterol. While regular exercise can improve good cholesterol and reduce heart disease risk, exercise alone might not be enough to combat the negative effects of obesity on general longevity. One recently published study followed 1.3 million Swedish men for an average of 30 years and found little longevity benefit for obese yet very fit individuals. On average, those young men died 30% earlier than their thin yet unfit counterparts when all causes of death were considered. This is less surprising when you consider that obesity has been associated with a diverse list of health problems extending far beyond heart disease.
Moving from large N to N=1
As a scientist, I find the trends and risks uncovered in large populations to be interesting, but I am also cautious about automatically extending their conclusions to me. Large studies like the one I mention above seek to eliminate variation by selecting subjects from a sub-population whose age, gender and ethnicity may in fact be quite different from mine. Broader population studies that employ statistical approaches that adjust for demographic diversity or focus on group-level trends may mask diversity in individual responses due to genetic variation, microbiome composition and environmental exposures (just to name a few).
Since I can’t replicate myself, I can’t do controlled experiments to determine whether lifestyle changes I make actually influence my own personal health risks in the future. I have to research what is known about generally applicable risk biomarkers, measure my own changes in those biomarkers in response to lifestyle changes over time, and hope that the statistical relationships between those biomarkers and future outcomes found in large-scale studies hold true for me.
Learning from my own past biomarker data
While reviewing my medical records to fill in missing weight data, I rediscovered historical data on my blood pressure and blood cholesterol, two major risk factors for heart disease. Requesting my medical records from past health care providers was free, costing me only a stamp and the time it took to fill out a request form. If you want to explore your own health history, I strongly encourage you to collect your own records and put your data into JMP!
As I shared in an earlier blog post, my first recorded set of detailed cholesterol measurements is from 2008. That year, I found out that although my total cholesterol number was near 200, my HDL (good) cholesterol number was only 52 ng/dl, nearly to the low threshold of 50 that is considered to raise heart disease risk. I was on an upward weight swing at the time, exercising occasionally, but exercise was not enough to balance out my routine overeating habit. My blood pressure was borderline high, but I wasn’t yet ready to face the choice posed by my health care provider: Lose weight and change my ways, or face the reality of blood pressure medication in the near future. Since I had gained another 10 pounds by the time I was due for my 2009 checkup, I never even scheduled it.
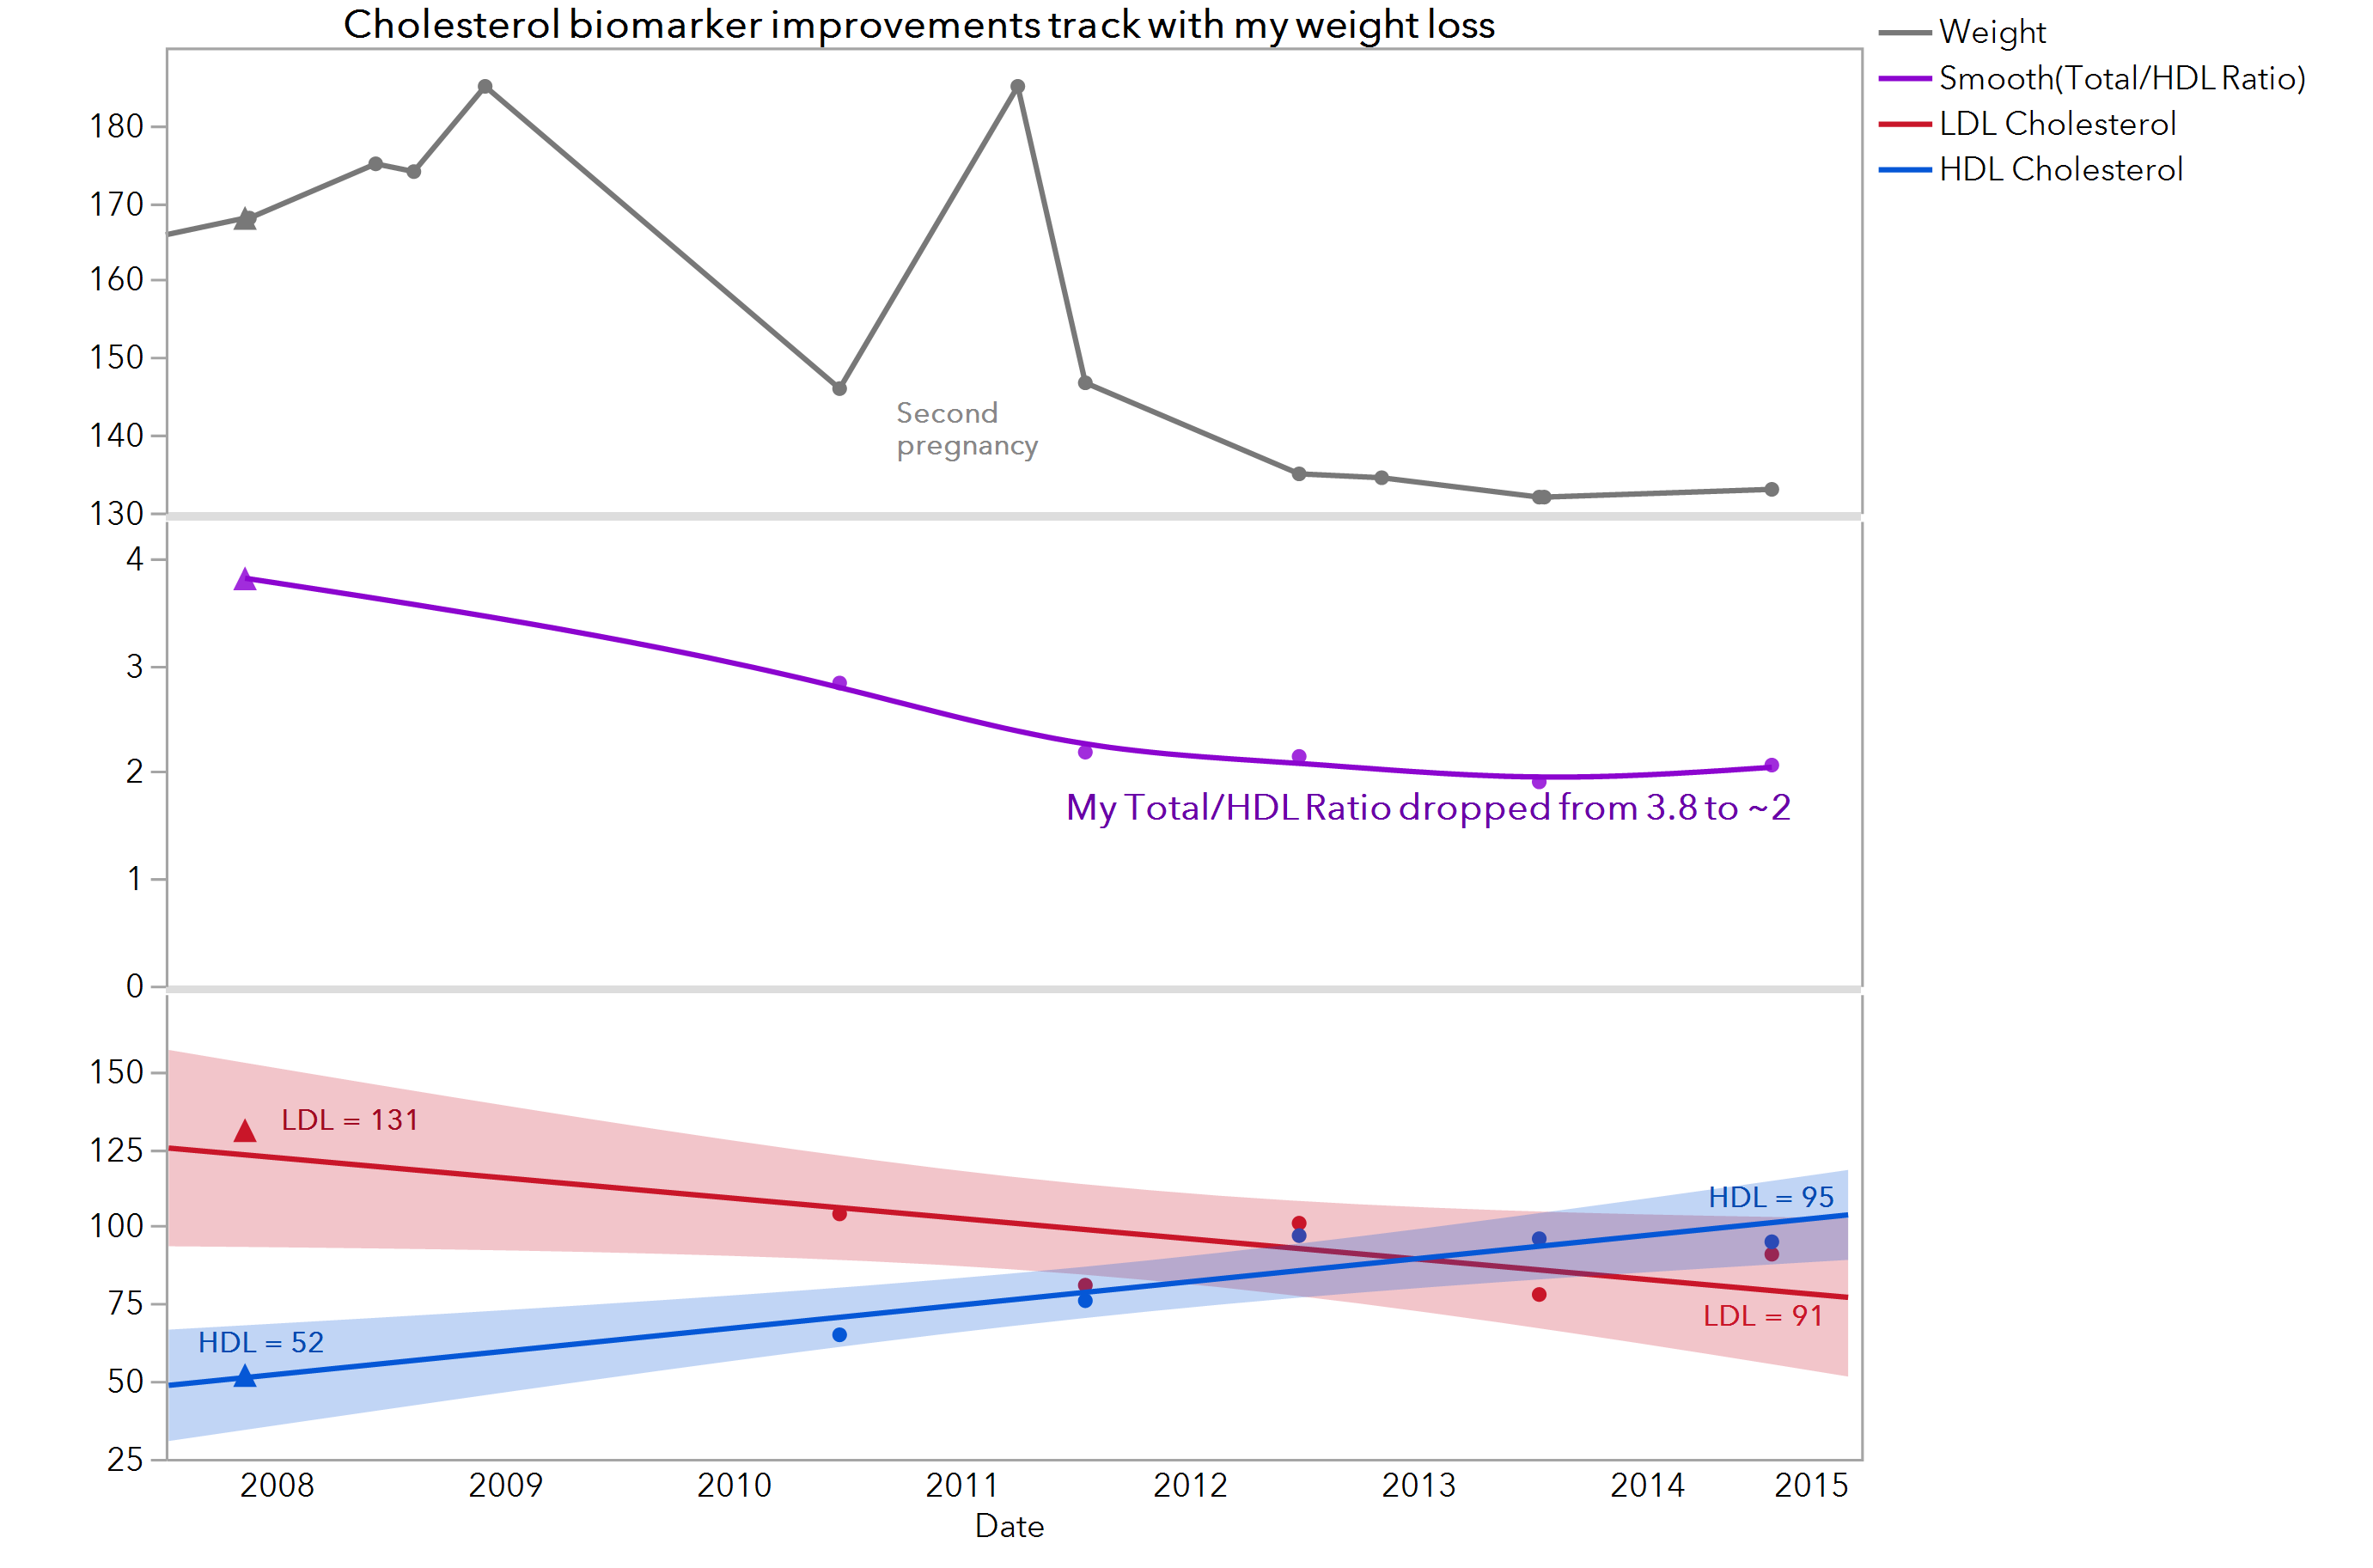
Something major happened in my biomarker data gap. I hit an important turning point and began to make changes.
I'm not proud of the fact that I avoided cholesterol and blood pressure tests from 2008 to late 2010, but I am thankful that something major happened during that data gap. In mid-2009, I saw pictures from a family vacation (some of which are included in the first graph above) and faced the reality of my weight problem. I resolved to change my habits for the better.
I reduced my daily calorie intake, started tracking my meals in a notebook, and added regular strength training and walking workouts. By my next checkup, my lifestyle changes had paid off. I had dropped 45 pounds, and my cholesterol composition had shifted dramatically for the better. My formerly borderline high blood pressure was now normal. Although my weight did rise again during my second pregnancy in 2011, I used the same strategies to shed the extra baby weight and return to my maintenance weight zone where my risk biomarkers have remained relatively stable.
An alternative graph of the data
I like the view above because it shows my data points over time. However, the simplified version below also has its advantages, showing that weight is not quite enough to explain my changing patterns. Although my post-baby weight in early 2012 was nearly identical to my non-pregnant weight a year before, my blood cholesterol level was clearly being influenced by other factors, likely some combination of caloric restriction combined with nursing a small child.
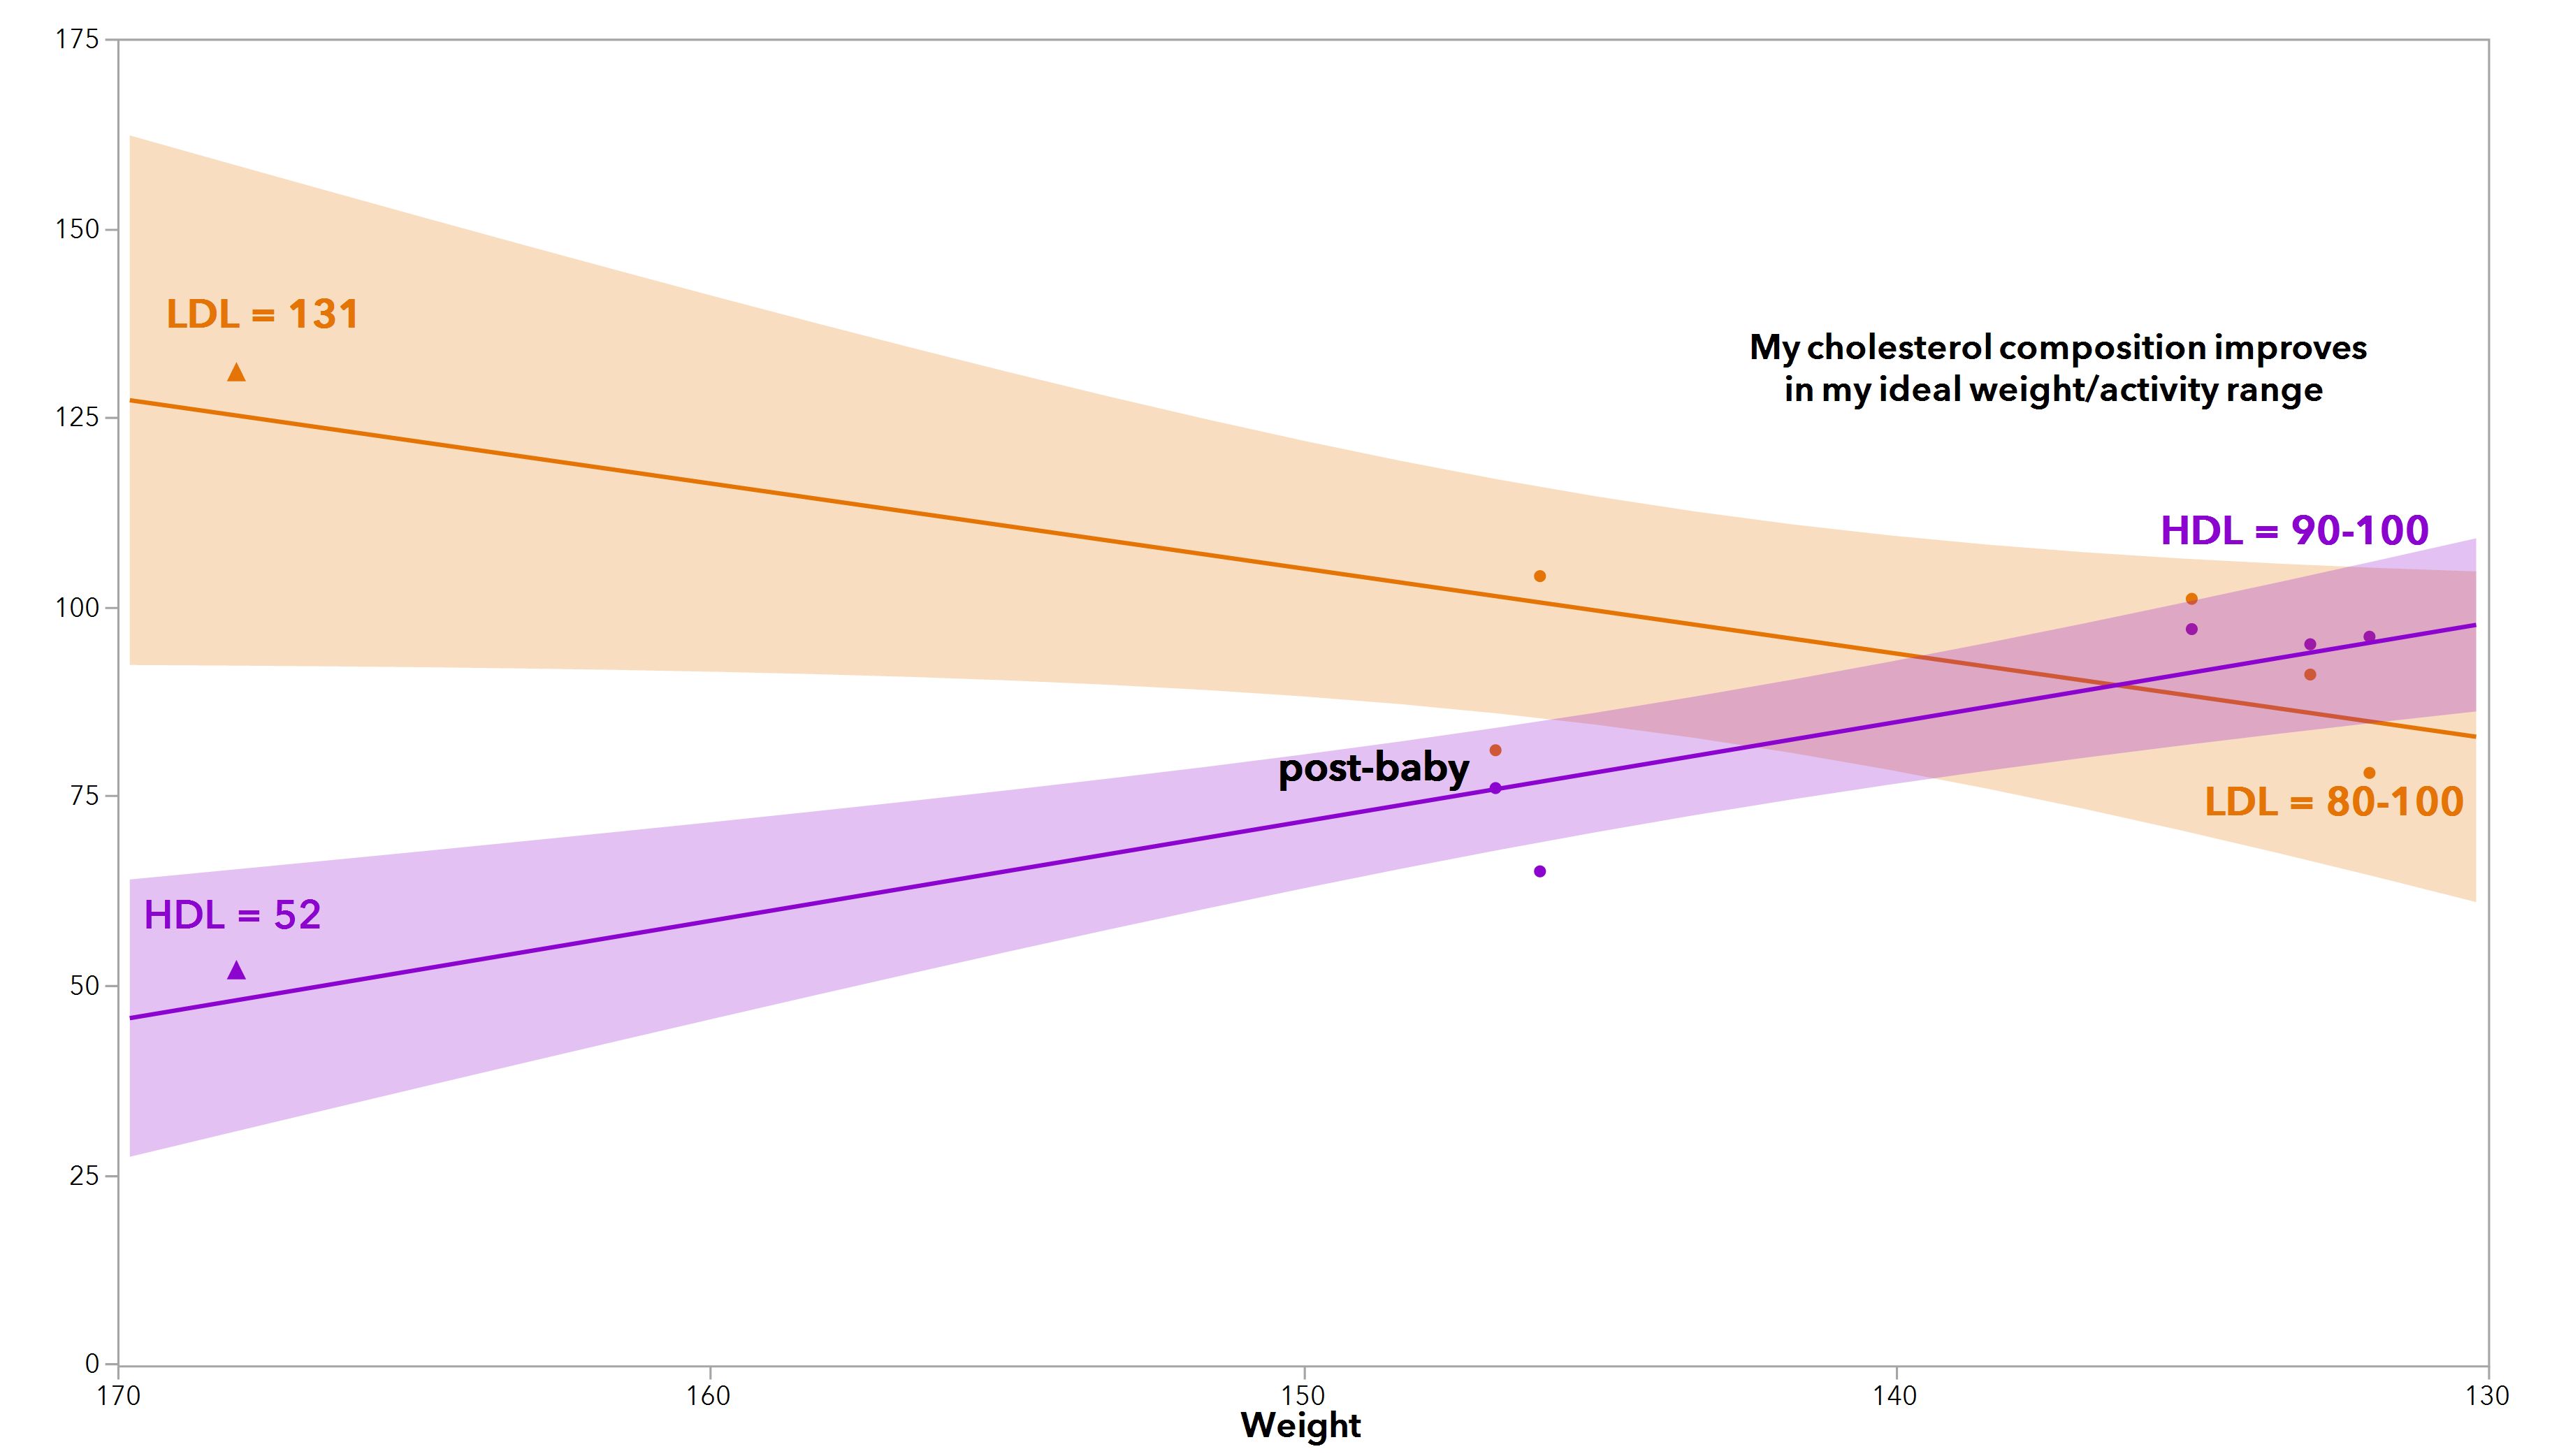
An alternative view of my cholesterol test data by weight.
Pondering the unknowns of biomarker measurement variability
I weigh myself each morning and measure my body fat because smartphone-connected sensors make the process quick and easy. I can connect up and down trends to weekly, monthly and seasonal changes in my eating and exercise habits. This daily monitoring practice has given me useful insights into how I can manage my fluctuations and stay within my comfort zone.
Unfortunately, the risk biomarker measurements I have collected from doctor’s visits are too few and far between to provide much understanding of the changes that could be happening as a result of shifts in my diet and activity patterns over time. If I had a sensor that permitted inexpensive replicate measures of various blood biomarkers on-demand and at home, I could probably begin to tease apart the technical and biological variation in the system and connect blood biomarker changes to trends in my eating and exercise habits. My limited experience with at-home measurements of daily fasting blood sugar and blood pressure has convinced me that there is clear variation in the system, but I don’t have the kind of replication required to separate the impact of technical and biological components of that variation.
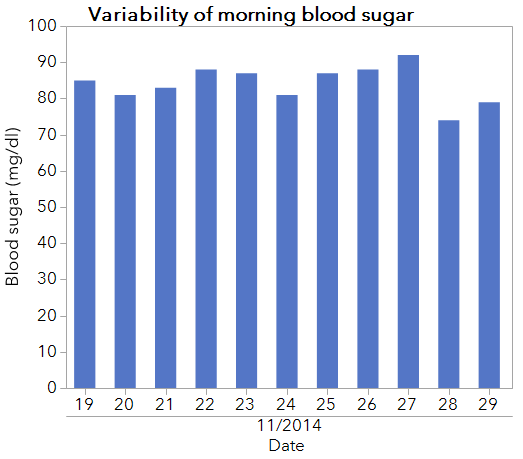
I measured my fasting glucose for a few weeks surrounding Thanksgiving 2014. Not surprisingly, there was variability from day to day!
Regardless, testing my blood sugar throughout several days (including Thanksgiving 2014) provided some helpful insights. Chocolate greek yogurt and cheesecake barely affect my blood sugar levels, while I was shocked to see a 130-point rise in my blood sugar levels after having a single piece of pizza and a honey cinnamon pretzel!
But as interesting as these insights into my personal blood sugar response patterns were to me, it turns out that they might be completely irrelevant to you. In fact, a recent study that used microbiome testing, extensive food logging and continuous glucose monitoring of 800 participants demonstrated that blood sugar responses to food are far from uniform across the population. Remarkably, some participants showed high and reproducible blood sugar spikes when they consumed foods generally considered to be "healthy" like bananas and tomatoes, yet displayed little to no blood sugar response after consuming "junky" foods like cookies. Others showed opposite responses. It was fantastic to see such well-collected evidence for something that I have believed for quite some time now: There is no one single eating approach that will work for everyone, and it requires some investigative work to find the right eating patterns that work for YOU.
Is understanding biomarker variability worth it?
Since I don’t live in that dream world where daily blood tests are easy and cheap, I am left to decide how much of my budget I want to dedicate to extra testing in the absence of a diagnosed medical problem. If it was really important to me to understand the variability of my lab results on a shorter time scale, I do have options today. At-home tests for LDL, HDL and tryglycerides are available. Or I could choose a direct-to-consumer (DTC) blood test option offering online ordering and blood draws at a service provider’s lab. DTC services like Inside Tracker go several steps further, calculating optimal biomarker levels based on personal attributes and offering personalized diet and exercise recommendations for athletes and others interested in optimizing their biomarker levels.
The question becomes whether I can justify the extra cost of repeated blood biomarker testing to understand the variability in my system, especially since my worrisome numbers appear to be a thing of the past. Intuitively, it seems obvious that routine monitoring of seemingly healthy individuals like me could reveal much about pre-symptomatic patterns that lead to disease over time. Frequent monitoring is certainly worth the extra cost for professional athletes, who must be on the lookout for nutrient deficiencies and signs of over training that could impact their performance.
But outside of competitive athletics, frequent testing of healthy individuals remains a controversial topic. If you don’t believe me, check out what happened to basketball team owner Mark Cuban after he tweeted last year that he has quarterly blood work and recommends it for anyone who can afford it. The headlines ranged from “Mark Cuban doesn’t understand health care” to “Mark Cuban is half right on blood tests “ to “Mark Cuban understands the future of health care.”
So which is it? Given the money pouring into the fitness wearables market and the shifting focus of many large health care companies and hospital systems to electronic medical records, home monitoring and digital tools and apps, I side with Mark and the big data revolution on this. I suspect that frequent biomarker tests are going to be the norm in the future, for healthy and unhealthy individuals alike. I look forward to the day when I can track my blood biomarkers as easily and cheaply at home as I can track other metrics.
For now, let Wear Red Day be your inspiration to keep track of whatever biomarker data that you can get, whether it's weight readings from your scale or data from your medical records.

