Process capability analysis is an essential part of Six Sigma and many other quality initiatives that are used in a wide variety of industries. It assesses how well a stable process is performing relative to its specifications and helps quality practitioners understand the current state of their process so they can make adjustments and reduce process variation, thereby improving quality and consistency.
Because process capability analysis is so important for achieving and maintaining high quality, we decided to make improvements to process capability in JMP 12. We designed a new Process Capability platform to make process capability analysis easier and more effective by adding more options, increasing flexibility and modernizing the graphs. The two central ideas that steered our development in the new platform were the following:
Process capability analysis should reflect the type of control chart used in the statistical process control program.
The potential performance of a process (sometimes referred to as short-term capability) and the past performance of the process (sometimes referred to as long-term capability) should be available alongside each other.
The new Process Capability platform that will be introduced in JMP 12 provides all of the options that are available in the current Capability platform (the goal plot, capability box plots, normalized box plots, summary reports and individual detail reports) plus the following new features:
A process can be subgrouped by grouping columns or constant subgroup sizes, reflecting X-Bar control charts.
Both within and overall variation are computed. Within variation is the variation within subgroups and is used to analyze potential performance (sometimes referred to as short-term variation).
Within variation is the process variation computed in X-Bar and R, X-Bar and S, and I-MR charts.
Overall variation is the variation of the total process and is used to analyze past performance (sometimes referred to as long-term variation).
The capability indices reports and most graphs are available for both types of variation. In the individual detail report, the distributions for both within and overall variation can be graphed on a histogram of the data.
Data table values that are outside of specifications can be selected and colored.
The Process Capability platform is designed to help users analyze multiple processes at one time. However, because it is important to analyze process capability in conjunction with process control charts, we have also added the individual detail report that is given in the new Process Capability Platform to the Control Chart Builder platform. The figure below shows this individual detail report that is available in both the new Process Capability Platform and Control Chart Builder Platform. This example uses the coating.jmp sample data table and gives the process capability analysis for weight using the sample column as the subgrouping column.
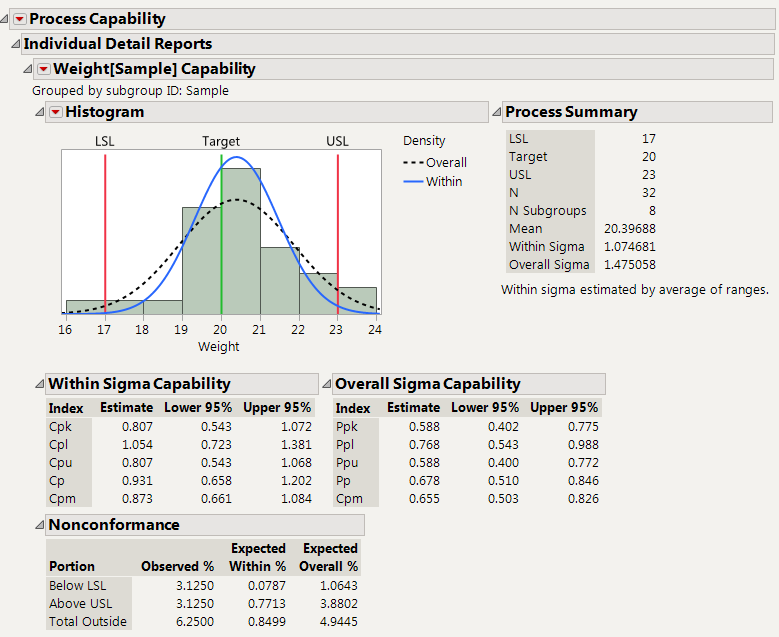
Individual Detail Report in the Process Capability Platform
Editor's note: This post is part of a series of previews of JMP 12 written by the people who develop the software.


