During the The Scale-Up of Chemical Processes conference in Brussels earlier this year, the organizers and I decided to do an experiment using JMP. Of course, the experiment had to involve beer tasting!
We had 24 participants for the experiment. We used eight Belgian beer brands for testing and planned the experiment using the Custom Designer in JMP. Participant and beer lists were available in electronic form so that both could be imported and used for the design. Each beer would be rated for aroma, taste, complexity and balance on a 1 to 5 scale, with 1 being excellent and 5 being poor. The Custom Designer took all of this information and delivered a list with a random assignment of four of the eight beers to each participant in a randomized order. Each participant also received a guide that gave some basic information about the art of beer tasting and how he or she should rate the four categories.
The newly trained beer experts took their job seriously and had well-informed discussions. During the experiment, we realized that there might be a severe gender influence, and although it was neither a blocking nor a randomized factor, we took it as a variable into the data table.

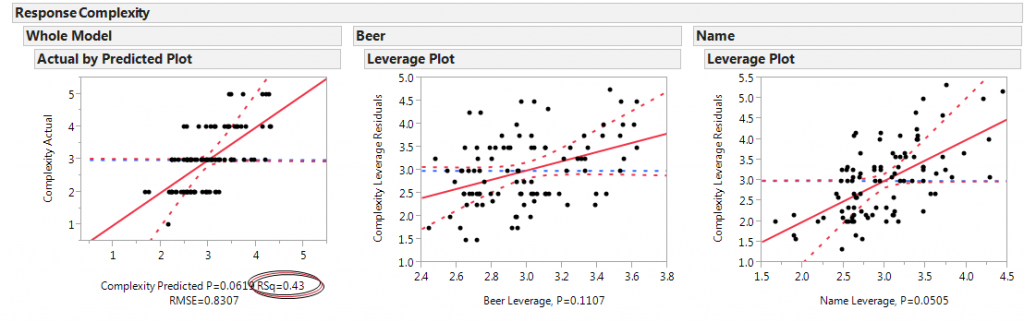
Looking at the model fits for the evaluation, we achieved Rsquare values between 33% and 43%, which are not acceptable for technical people but good for this type of experiment. In both models, the influence of the raters on the respective responses was higher than the influence of the beer brands themselves (you can see that the slopes of the red line for “Name” are steeper than that for “Beer”).
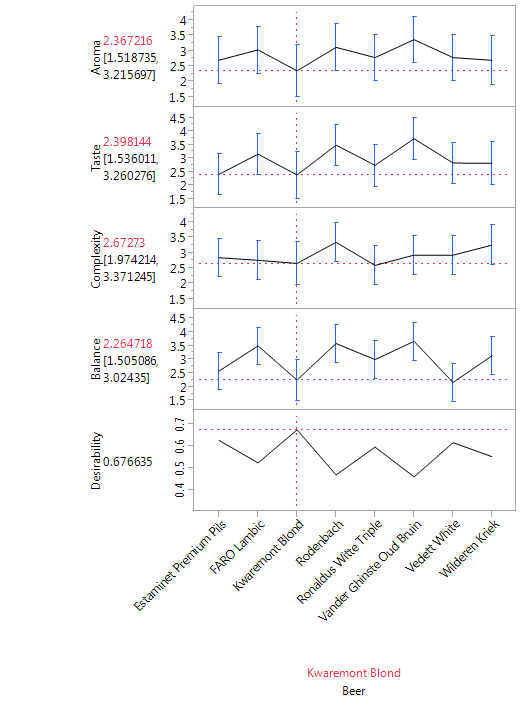
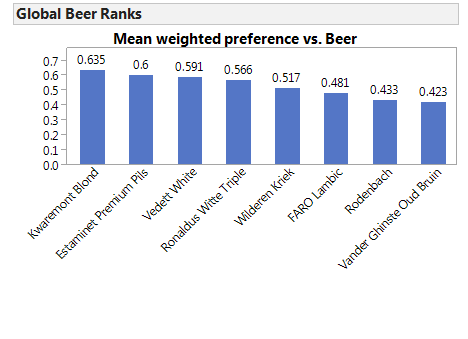
In order to find the best beer, we used the optimizer in JMP, which combined the influence of every beer upon all four criteria and selected the beer with the best overall rating. In our test, this was Kwaremont Blond. We saved the formula for this weighted combination of criteria per beer back to the data table. Thus, we were able to calculate the relative preference for each beer.
Returning to the question of gender influence, we separated the male and female cohort.
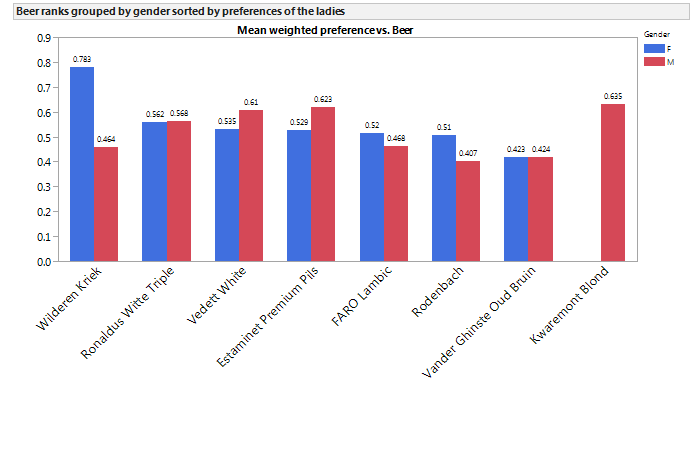
The bar charts ordered by the preferences of the ladies show a clear preference for Wilderen Krieg, which is a sweet cherry beer. For the male participants, Kwaremont Blond was the preferred beer, a brand that was not tested by women at all.
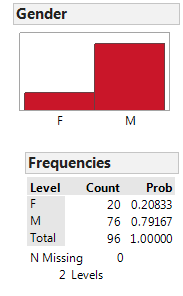
Because men outnumbered women by 4:1, the overall ranking reflects the men’s preferences:
We treated the ratings for the different criteria in this analysis as continuous variables, which is not correct. We should have analyzed them as ordinal variables. However, this takes much more effort, and it would have been more difficult to produce summaries. Finally, we looked at the preference model that combined the five influence functions per criterion.
When doing this exercise, the ranking remained essentially the same. Only Estaminet Premium Pils and Vedett White changed their positions. Not a major change, since their average ratings did not differ much anyway.

Here are the top three beers:
Kwaremont Blond
Estaminet Premium Pils
Vedett White
So the next time you visit Belgium, look for these favorite beers. Statistical planning and chemical expertise can’t be wrong! You can have a chance to taste them if you attend Discovery Summit Europe 2015 in Brussels. Registration is now open. Hope to see you there!

