JMP 11 provides a convenient way to convert a continuous numeric column into a new column that represents a sequence of ranges. The command is called Make Binning Formula in the Columns menu. It brings up a dialog that lets you interactively choose the binning parameters (offset and width) and the format of the new column.
Here is the heart of the dialog being used to bin the Birth Years column from the Consumer Preferences sample data file.

I've set the parameters to create 10-year bins corresponding to decades. The drop-down menu in the upper right offers a variety of output formats, and I've chosen “Low – High-1” -- which works well to clarify the endpoints for integer data. In mathematical terms, the range is closed at the low value and open at the high value. The result is a new column that contains the following formula:
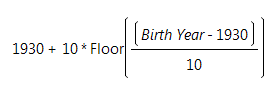
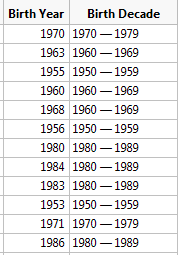
The formula is straightforward since it doesn't create the actual text to describe the range. That part is done by a Value Label column property, which is added automatically. Here are a few rows of the new column, which I renamed "Birth Decade," next to the original column.
Now, why are we doing all this? In general, it can be useful to create bins to look for coarser effects in a data set. In my example, I want to create a histogram-like bar graph so I can compare the counts of males and females in a single graph. Here’s the regular histogram view of Birth Year for both genders.

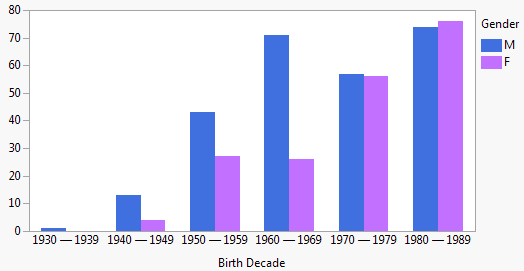
After making the binned column, I can use Graph Builder with a bar element to interleave the bars and focus on the differences in the two groups by decade.