Interactive HTML is a new technology for sharing results in JMP 11. In a previous post, I showed these examples:
Diamonds (Distribution Analysis)
Movies (Multivariate Analysis)
Sales per Employee (Fitted Model)In this post, I want to describe in more detail how to use this new feature. There are two ways to create interactive HTML files: from the JMP desktop or from a JSL script.
From the JMP desktop, on Windows, choose "File: Save As: Interactive HTML with Data."
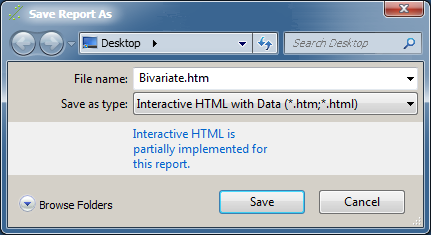
On Mac, choose "File: Export: Interactive HTML with Data."

Notice in both dialogs the phrase "with Data." The way we make the HTML interactive is by exporting the original data. If you have sensitive data, you may not want to share it. In that case, use the "HTML" format instead. This produces output that is static, not live -- yes, sort of like a zombie  -- and it keeps your data safe.
If you will be creating interactive HTML files frequently, it is convenient to script them. You can do this in JSL using the "Save Interactive HTML" operator:
// Exports a Bivariate Fit.
dt = Open( "$SAMPLE_DATA/Big Class.jmp" );
obj = Bivariate( Y( :weight ), X( :height ), Histogram Borders( 1 ), Fit Line );
obj << Save Interactive HTML( "Bivariate.html" );
Open( "Bivariate.html" );
Once you have created your HTML file, you can share it on the Web, on your corporate intranet or email it to colleagues. Opening the file in a Web browser will display results like this:

Interactive HTML is a new technology for JMP, one that could take us in many directions. My fellow developers, John Powell and Josh Markwordt, and I are happy to be working on this project, and we are most interested to hear what our customers want. So, please let us know in comments.


