Back in August 2012, Laura Higgins, a JMP systems engineer, wrote a great blog post titled “Fighting crime using geospatial analysis in JMP.” In that post, she explores crime data for San Francisco. When she was working on that post, she contacted me and asked if there was a way to produce a street-level map of San Francisco in JMP. At the time, JMP could generate maps at a higher level using Simple Earth and Detailed Earth. JMP could also use an external mapping server such as the NASA server or the Web Map Service (WMS). But unless you knew about a WMS server that would generate a low-level map of San Francisco, there was no way to get the map Laura wanted from JMP.
So I did the next best thing. I manually generated a map for her and added it into her graph as an image. But generating the image was a bit tricky. I had to find a server that would generate the map tiles that I wanted. I figured out exactly which tiles I needed and how to specify that as a URL, and then I sent the request through a browser to the mapping server. I did this for multiple tiles, saving each one that was returned, and then stitched them together to create one image. Then I had to manually position the image in the background so that it was located correctly under the data.
Laura was happy to get this “map,” and I was happy to create it for her. But obviously there are issues with this approach. For starters, the whole process took a certain amount of knowledge about maps and probably more time than most people would want to spend. Second, the map was generated at a specific zoom level. So if you tried to zoom in, a new map would not be generated. No more detail is added, and the map itself simply scales up, causing a noticeable degradation in the quality of the image. Third, the map only covers a specified area. If you were to pan in any direction, there would be no visible map, just a white background. Lastly, and probably of most concern, the image had to be manually, but correctly, positioned in the graph. If the map is not in the proper location, the visualization is completely misleading.
Of course, you could use that last issue to your advantage. Suppose you wanted to buy a house in a certain neighborhood in San Francisco. After looking at the crime data, you decide that neighborhood has too much crime. Well, you can just slide the map over -- and presto chango -- your future neighborhood is now crime free! That’s right, we’ll just put all that crime out in the bay. Ah, if only it were that simple to get rid of crime in your neighborhood.
Well, I am happy to say that now with JMP 11, Laura can get the map she wanted right from JMP -- and so can you. JMP 11 offers a new background map option called Street Map Service. Like some of the other mapping options in JMP, the Street Map Service uses an Internet connection to access a mapping server that will automatically generate a map for you. But unlike the Web Map Service, you do not have to tell JMP how to get to the server. The server is owned and operated by JMP, so the JMP product knows how to find it.
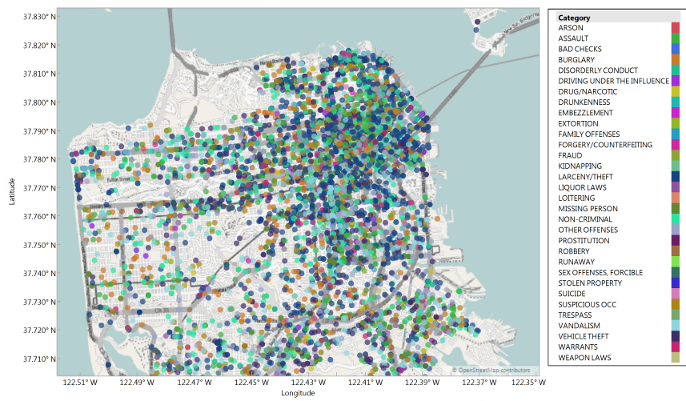
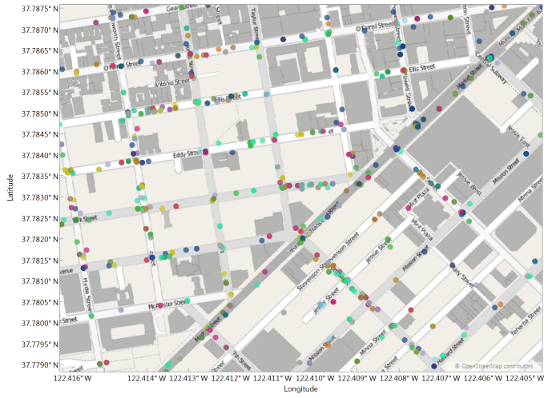
The server generates maps on demand using OpenStreetMap technology and data. JMP uses your axes to generate a map with the correct coordinates and calculates an appropriate zoom level so you get the right amount of detail. Zoomed out, the map shows country and state names with major highways. The detail in the map increases as you zoom in, revealing minor roads, street names and building footprints. Maps are generated using a soft color scheme to enable your data to stand out.
So now you can get a view of the San Francisco crime data that looks like this:
Or even this:
Of course, San Francisco is not the only place with crime, and Bubble Plot is not the only platform in JMP that uses background maps. Here is a contour plot in Graph Builder showing crime in Raleigh, North Carolina.
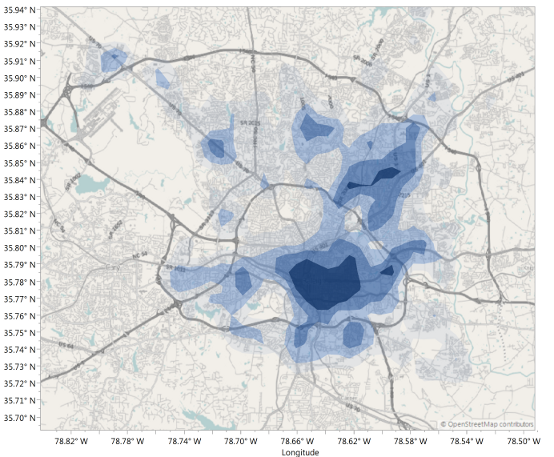
The Street Map Service can generate a map for any location on Earth. So whether you want to explore real estate values, high-crime areas, the best restaurants or all of the above, the Street Map Service in JMP 11 will help you visualize your data. The Street Map Service lets you zoom out to get an overall view and zoom in to specific neighborhoods or even down to the street level, providing you with the appropriate amount of detail and a high-resolution map at every level.
What kind of data will you be visualizing with the Street Map Service?

