This is a picture of the bottom of an elephant's foot. As you might guess from looking at this picture, this is not a very happy elephant. Elephants kept in captivity often spend their time walking on pavement or other hard surfaces. This is not the substrate they are used to, and it is not what an elephant's foot was designed for. Consequently, this elephant has developed sores on his foot, and in some cases, those sores have even become infected. The caretaker for this elephant is providing treatments, but the elephant continues to walk on his foot, causing further damage. So the caretaker is left wondering if the treatments are helping at all.
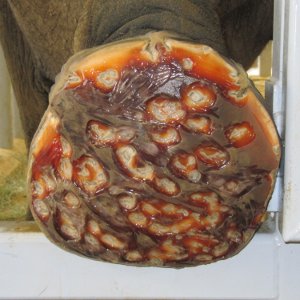
I was given a copy of this photo with this question about image analysis: Is there a way to quantifiably measure the condition of the foot so that over time it can be determined if the treatment is having a positive effect?
Looking at the image, I can see that all the areas of the foot basically fall into one of three categories:
There are the areas that are brownish in color, which represent the normal color of the elephant's foot. Those areas are healthy.
There are areas that are some shade of orange. Those are the areas that have developed sores.
Then there are the whitish areas within the sores. Those are the areas where the sores have developed into an infection and are now full of puss.
By categorizing the entire foot into those three buckets, I felt we could get a measure of the condition of the foot. It is important to ignore the background, those areas in the image that do not show the bottom of the foot, so as not to skew our results.
I read the image into JSL (JMP Scripting Language) and got the pixel values from the image as red, green and blue (RGB) values as separate matrices. I could then convert these individual matrices into one matrix, representing all three color components.
img = newImage("elephantFoot.jpg");
{r, g, b} = img << getPixels("rgb");
colr = RGBColor(r, g, b);
But oftentimes, it is better to analyze color in a color scheme other than RGB. So I really want the colors in a color scheme called HLS, which stands for hue, lightness and saturation. The hue is basically the tint of the color, the lightness is the brightness, and the saturation is how much color there is as opposed to how much white. Fortunately, JMP provides a method for converting from RGB to HLS.
{hue, lit, sat} = ColorToHLS(colr);
Now that I have my color in HLS, I can create a JMP data table of my pixel values.
dt = New Table("Pixel Data",
newColumn("Hue", set values(hue)),
newColumn("Lit", set values(lit)),
newColumn("Sat", set values(sat))
);
The reason to do this is so that I can use some of the statistical power of JMP to analyze my data. I’m curious about the breakdown of my color values, so I decided to create a Distribution of each of the color components.
Distribution( Continuous Distribution( Column( :hue ), Outlier Box Plot( 0 ) ) );
Distribution( Continuous Distribution( Column( :lit ), Outlier Box Plot( 0 ) ) );
Distribution( Continuous Distribution( Column( :sat ), Outlier Box Plot( 0 ) ) );
Here is the result.
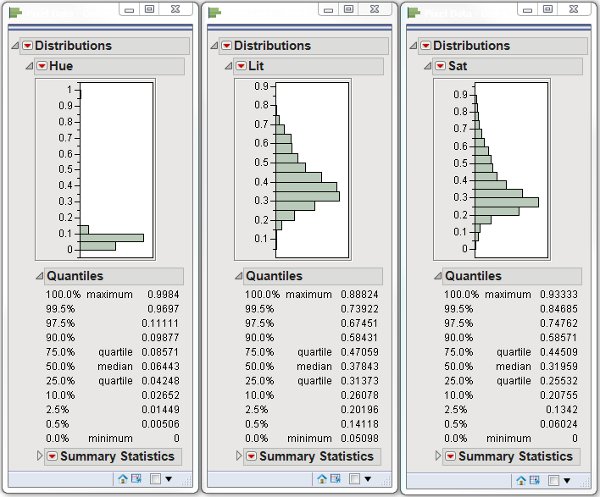
By looking at my Distributions, I can take a good guess as to what values to look for in my data to identify what pixels are brown, orange or white. I process each pixel, represented by a row of data in my data table, and I am able to categorize each one. I then can report my results.
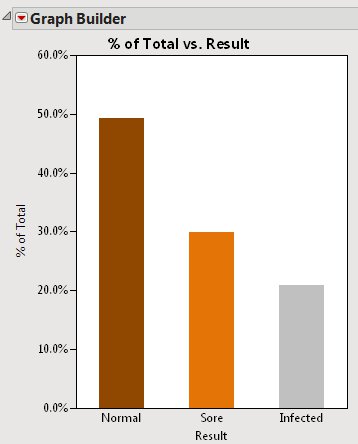
To generate my report I selected all my missing values (all the pixels that represented the background area) and set them to hide / exclude. I then generated a summary table from my pixel data table. I can then use Graph Builder to generate my graph.
The result is that about half the foot is in good condition. For the half that is not normal, about 30% has developed sores, and the other 20% is infected. We now have a quantifiable measure of the condition of the foot. By doing this over time, we can determine the condition of the foot and know whether or not the treatments are helping.
The image of the elephant’s foot came to me through an organization called WildTrack. WildTrack is dedicated to the preservation of endangered species as well as the overall well-being of animals in the wild.
WildTrack is a JMP customer who will be featured in an upcoming webcast, Analytically Speaking. If you found this blog post interesting, I encourage you to register and attend the webcast. I can assure you that their talks are always fascinating and informative. And as always, please let me know what you think.

