I’ve been looking into crime − 9,134 rows of crime to be exact. After reading about geospatial analysis of crime in The Police Chief magazine, I decided to do this in JMP.
So, I downloaded all of the individual crime incidents from April 2012 from the San Francisco government data website. Then, I began my geospatial analysis in JMP.
One challenge for police and other public safety officials is deciding where to put patrols to effectively reduce crime incidents. One idea is that traffic incidents co-occur with more serious crime, commonly called the Data-Driven Approaches to Crime and Traffic Safety (DDACTS) model.
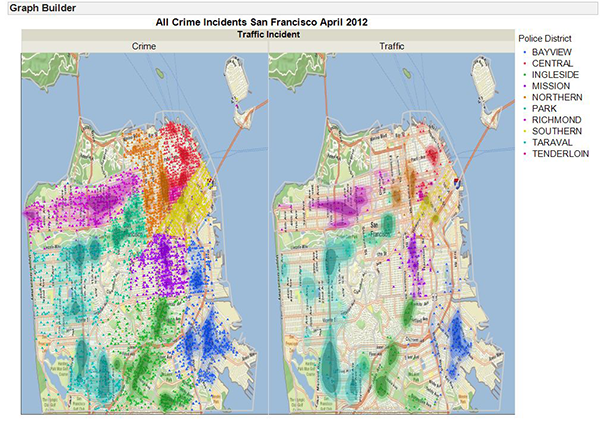
To explore this idea in JMP, I recoded the data into traffic and non-traffic incidents, and used Graph Builder in JMP to overlay density maps of each precinct. You can see that traffic and overall crime did have a similar pattern in April in San Francisco.
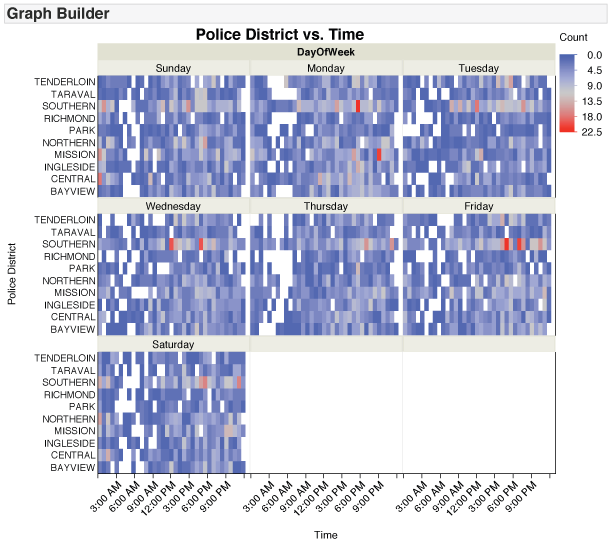
Finally, I wanted to know more about when incidents occur. Again, I used Graph Builder, this time to make heat maps based on time, date and precinct. The heat maps provide a great overview, and they would be a helpful tool for staffing and force planning. At first, I was a little surprised that 6 pm is a high crime time in downtown San Francisco, but then I realized that is when everyone is out and about − including me!
Note: Scott Wise of JMP contributed to this post.


