I just love the iPad!
In it, Apple has combined mobility and raw computing power with an amazingly responsive touch interface. When I first saw it, I thought, "We need to put JMP on this device!" And there is one component of JMP that practically screams to be on the iPad: Graph Builder.
So about 18 months ago, a small team of us started porting Graph Builder to the iPad. We had in mind building an app that could open a JMP data table, show the Graph Builder graphs stored in it, let you change those graphs or make new ones, and share your results. If you take your iPad to a meeting, you could open a JMP data table from an email attachment and project a graph on a screen. Then you could play "What If" games with your data right there, collaboratively.
Or you could use desktop JMP to prepare a data table of raw data for a class of students. They would download the data from your website directly into Graph Builder on their iPads. From there, your students would explore the data, build an analysis, and email the graph back to you.
We were excited by this idea, but we wanted our new app to have a different focus from desktop JMP. There, when you open a data table, that's the first thing you see -- the data. Our focus is instead on the graphs, so we show you a gallery of your data tables with thumbnails of the graphs you've made for them.
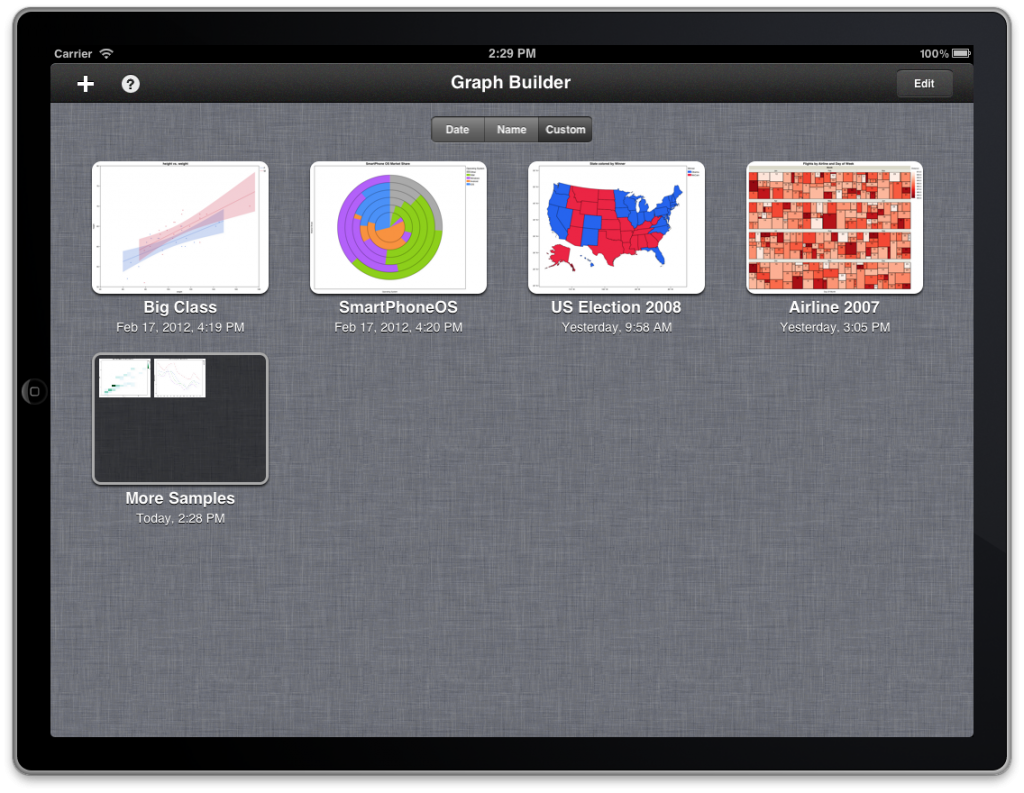
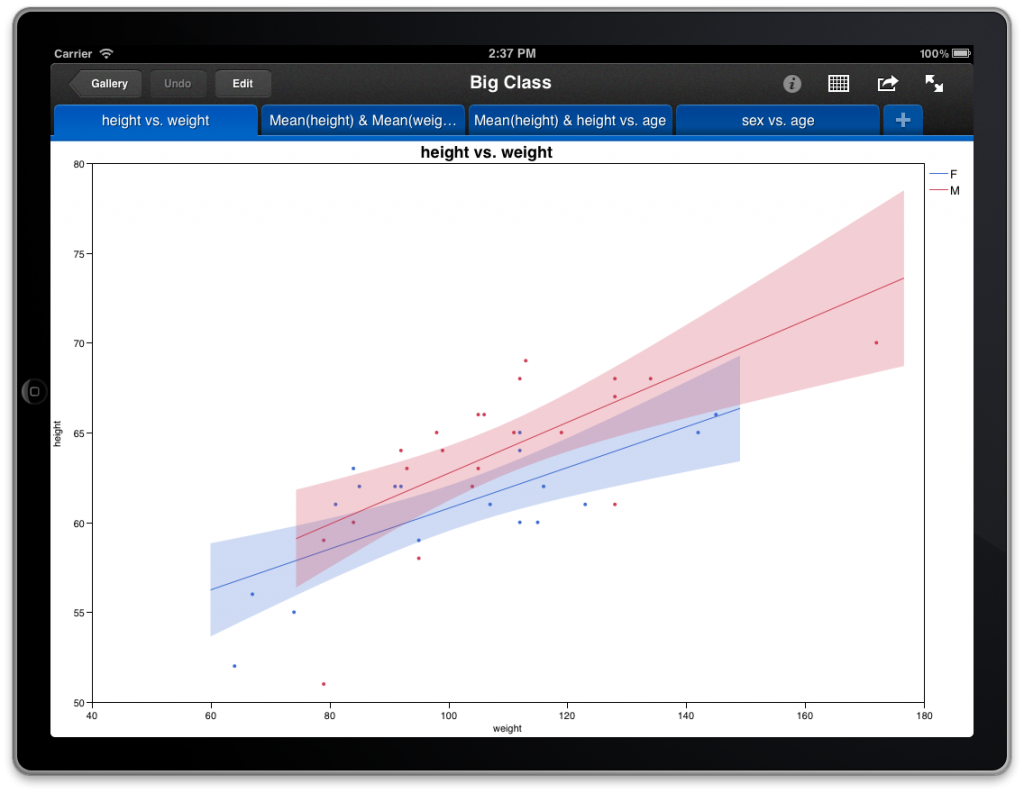
Tap on one of these and it opens, showing you a beautiful full-screen view of your graph. Of course, you might want to present the data in your table several different ways, so we let you store multiple graphs in each one. They appear as tabs across the top.
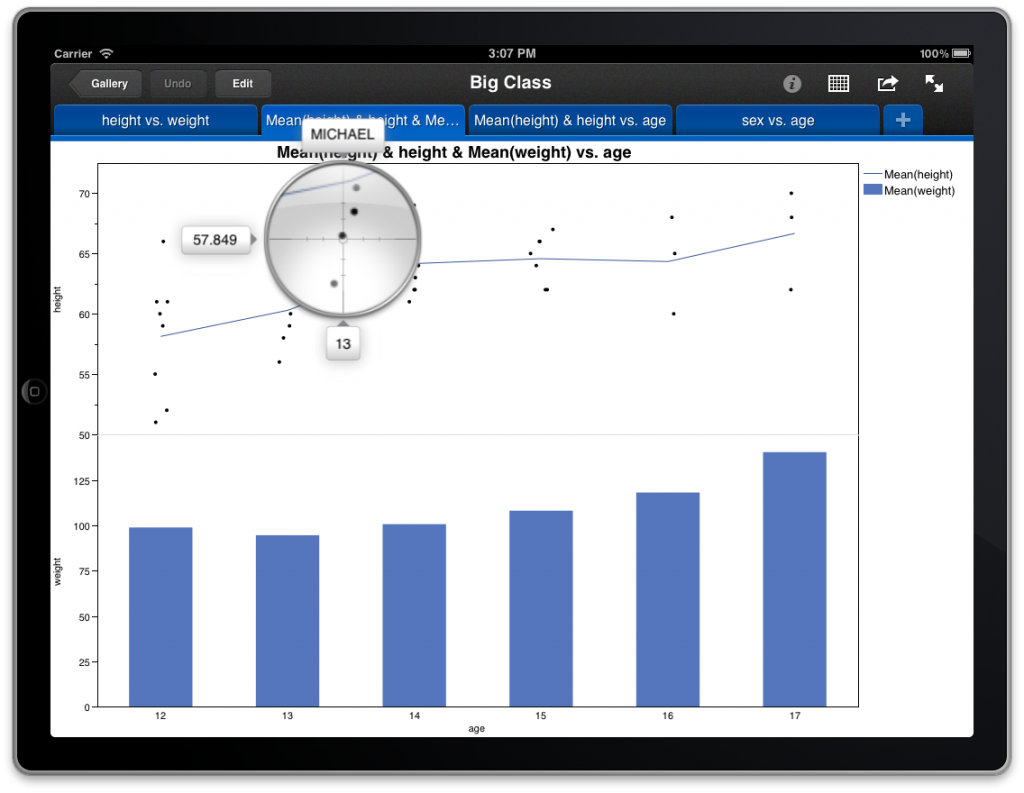
But we wanted to go further. So we created a tool to let you inspect the numeric details of any graph. Tap-and-hold on your graph, and up pops the magnifier. This tool shows you a magnified view of what's under your fingertip, with tags identifying the axis values at that location. Some graphs will show you even more information, like the label for the data point you're pointing at; or the county, state, or country you tapped on. Just slide the magnifier around your graph to see all the details.
But the real fun begins when you tap the Edit button. This puts you in "Edit Mode", where you can completely change your graph, or make a brand new one. Tap and drag columns from the list on the left to Graph Builder drop zones just like you do with desktop JMP. Graph Builder responds immediately. It's really fun to experiment!
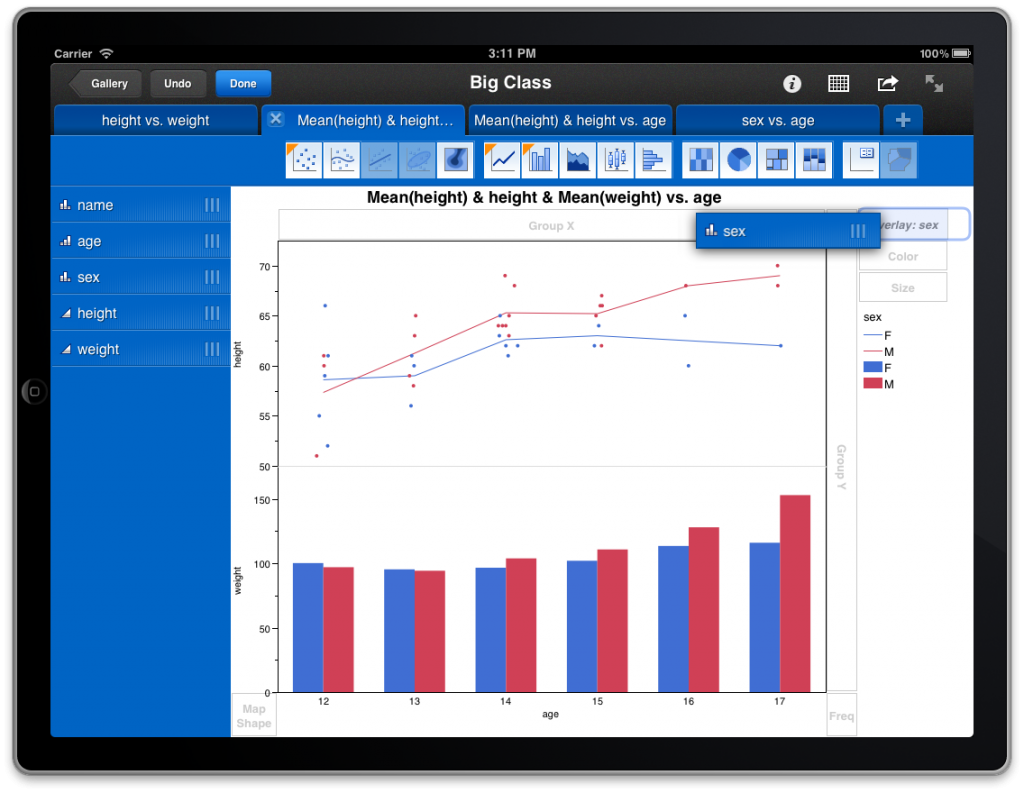
You can use the icons along the top to change what kind of graph you are creating. You can also tap-and-drag one of these icons to create a graph with multiple graph types, either overlaid or side-by-side. For fine-tuned control, tap the Info icon.
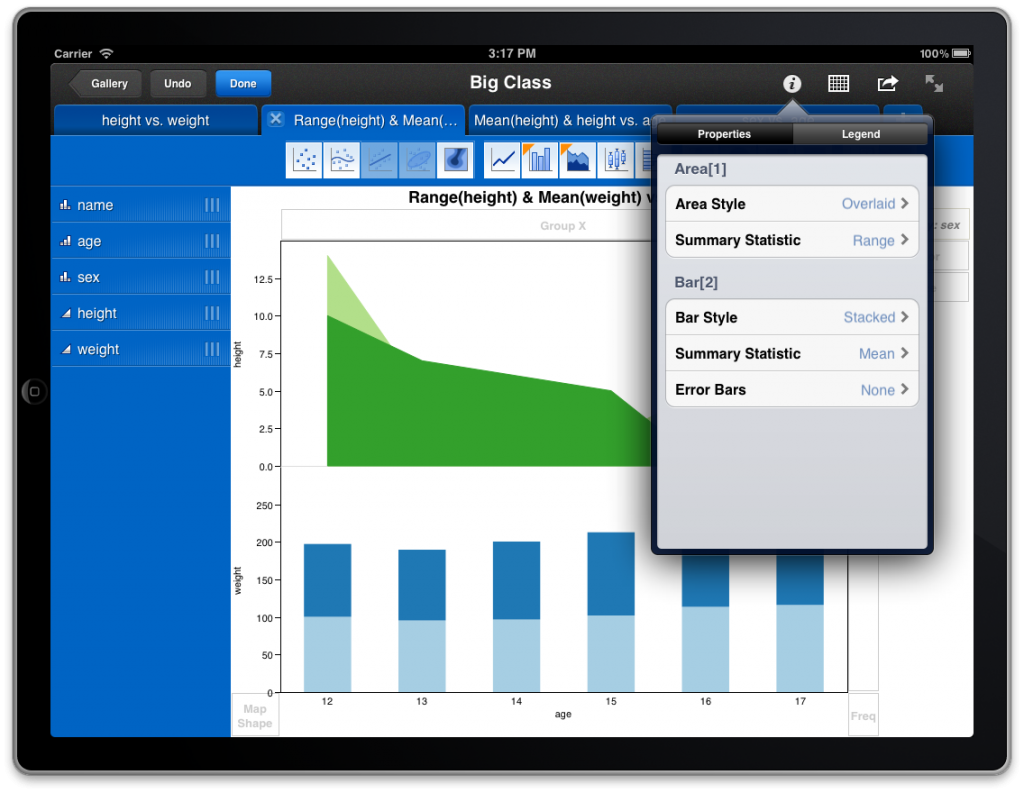
From here you can control how Graph Builder draws your data. Want those bars stacked or that area plot overlaid? Just tap the switch. And under the Legend tab you can change things like color themes and line styles.
We're thrilled to bring you this new app. We can't wait for you to start using it to explore your data and share your discoveries. But the best part about JMP Graph Builder for iPad is that it's free. Download it from the App Store and start building your own graphs today!
Editor's Note: You can also check out the Help page for JMP Graph Builder for iPad.


