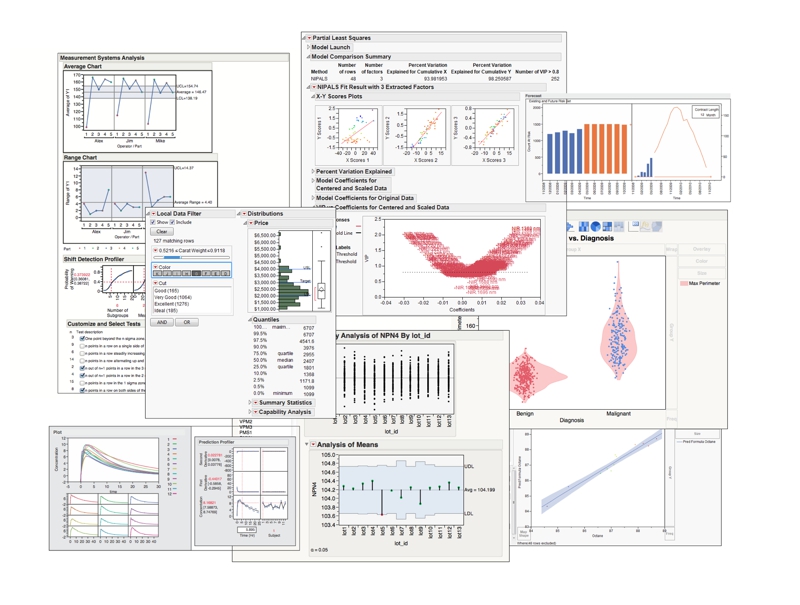
 With the JMP 10 release right around the corner, you might be asking yourself: What are the latest and greatest features that will available to me when I install this new version? I found myself asking the very same question when I first installed the beta and subsequent early adopter versions while preparing the JMP 10 fact sheet and other JMP 10 product information materials.
I can tell you – this is a big release with many amazing additions that you will find both exciting and useful. I found it hard to limit the “great things” about JMP 10 to 10 items – since there are so many new features, improvements and analysis platforms – but “Ten for 10” does have a nice ring to it, so I’m going for it.
Before I start the list, the first thing you’ll notice about this release is just how fast it is. The JMP developers have further optimized support for multi-core CPUs, which make JMP blaze through importing huge data files and working with data once it’s into a JMP table.
I have a proposition for you when you first install JMP 10: Search around your computer and find the largest data set you have and try using the Graph Builder platform to visualize it. You will be amazed how effortlessly JMP creates different visualizations as you drag-and-drop your data into Graph Builder – even if it has tens of millions of records.
Ten great things about JMP 10
The Graph Builder, the revolutionary drag-and-drop, interactive way to build a graphical analysis, has been greatly improved to make visual discovery faster. Icons are now provided to switch between graph types through a dedicated panel. Graph Builder also includes more customizations, and even the ability to launch the Fit Model platform to determine if a trend you see visually is statistically significant.
The Local Data Filter is a data filter that you can add to many platforms that lets you filter and focus on specific categories without disturbing the original data table.
The Column Switcher saves the hassle of having to repeat the same analysis over and over when you have many columns of data that need the same analysis performed on them. It’s easy to interchange columns, even if you have thousands of columns, by just adding the Column Switcher within a platform. The switch can be performed manually by clicking or using the arrow keys, or even animated.
The Control Chart Builder is a drag-and-drop way of building control charts analogous to Graph Builder. The platform automatically configures the control chart depending on the type of data you are looking at. You can also drag grouping or phase variables and get a handle on your process control data very efficiently.
The Reliability Forecast platform lets you analyze warranty return data to create reserve forecasts. It lets you perform what-if analyses adjusting production volume, forecast length and contract terms.
The Reliability Growth platform lets you model the reliability of a single repairable system over time as improvements are incorporated into the design. This platform fits Crow-AMSAA models and also features a useful change point detection fitting procedure that automatically determines when phases of the reliability model have changed.
The Measurements Systems Analysis (MSA) platform provides a method for assessing the variation in your measurement system and gauges. The platform was developed under the guidance of Dr. Don Wheeler and his book:
EMP (Evaluating the Measurement Process) III: Using Imperfect Data. One of the great features in this platform is the ability to use the Shift Detection Profiler to explore the MSA-space and interact with your ability to detect a warning.
The Nonlinear platform has a powerful new way of fitting curved data without the need to pre-impute a formula or starting values. Simply select from one of the models in a rich library, which includes popular bioassay or pharmacokinetic models, and your data is fit automatically.
The Partial Least Squares (PLS) platform has been greatly improved and now includes a richer set of graphs and reports.
The Custom Designer includes numerous important improvements, which let you set up discrete numeric factor roles, and the number of runs is automatically updated when center-point and replicate runs are changed. In addition to these improvements to Custom Designer, a new
Evaluate Design platform lets you evaluate any JMP data table treated as a design, change model and alias terms, and see updated diagnostics.
So, there we have it! Ten great new features in JMP 10 that should make you very excited to get your hands on this release. If you’d like to see a preview of some of these new features and platforms in action – look for a brand new video overview of JMP 10 coming in the near future.

