On more than one occasion, I have been asked why we added image functionality to JMP. After all, JMP is a statistical software package. What is the value of imagery and what can you do with images in JMP? Well, there are a number of reasons for adding the functionality, and there are lots of things you can do with images in JMP. The most basic reason, however, is simply that an image can add context to your data. Let me explain through an example.
Let's start, as we often do in JMP, with our data. I'll use a data table called Chicago Wind. The data, as the name implies, captures recordings of wind speed and direction. In this data table, there is a script that generates a Bivariate Fit and displays the wind data as arrows.
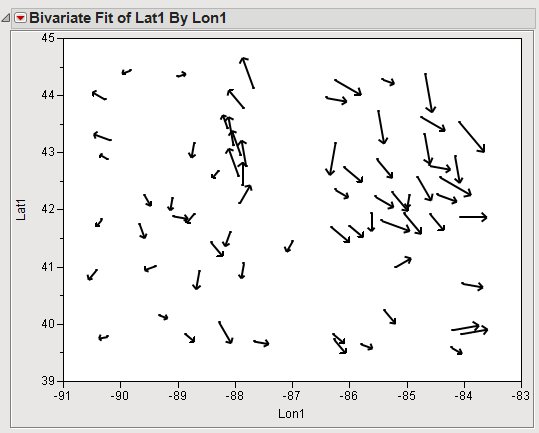
If you have ever watched a weather report on your local news channel, this type of graphic will be simple to understand. The arrows point in the direction of the wind, and the size of the arrow indicates the magnitude, or speed, of the wind. Along with this data, I was given an image file called windmap.png. The image shows a map of Lake Michigan and the surronding area. It is covered with little dots, indicating the location of observation stations.
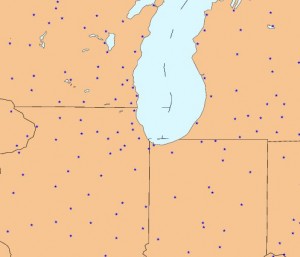
If this looks familiar to you, it may be because I demonstrated this example at the JMP Discovery Summit in September. I can drag and drop the image into my graph. I can then interactively reposition and stretch the image to fit the data. I can even right-mouse-click to get to the image submenu and apply some transparency to the image. This will soften the image enough such that it still is visible and adds context to my data without overpowering the data itself.
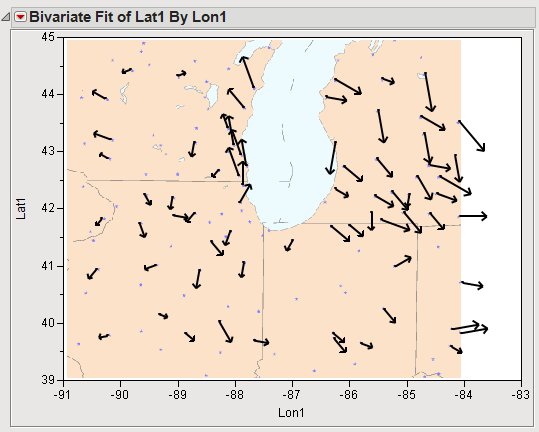
I now have a visualization that I can use to draw some conclusions about why the arrows vary in both size and direction. If you look back at the previous graph with no image, you see lots of arrows. But all you can tell is that the wind varies. There are not any cues as to why. Once you add the image, your graph has some context. This context helps explain why the wind varies so much in both direction and magnitude over a relatively small area. Do you know why?

