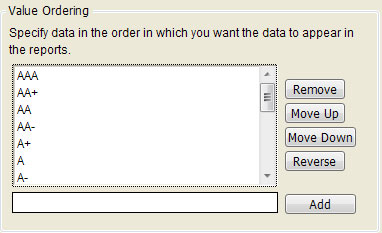
When JMP has to put categorical values in order, such as in table rows or a graph axis, it will use alphabetical order if there is no order defined for the column. JMP knows about the order of a few common categorical values, such as month names and Likert scale values. For others, you can add a Value Ordering column property. For instance, A-level credit ratings would be ordered alphabetically as “A, A-, A+, AA, AA-, AA+, AAA.” However, you can have them always ordered from best to worst by adding a Value Ordering property to the column:
That’s fine for static, predetermined ordering, but what about more dynamic order? For instance, how would you organize a bar chart or histogram so that the bars are in descending order of length? That’s a job for Graph Builder’s little-known ability to apply an order variable to any categorical axis.
Let’s say I have a file with sales data by Distribution Channel, Customer ID and Product Line:

I want a distribution graph organized by the number of records by product line. I first create a distribution graph:
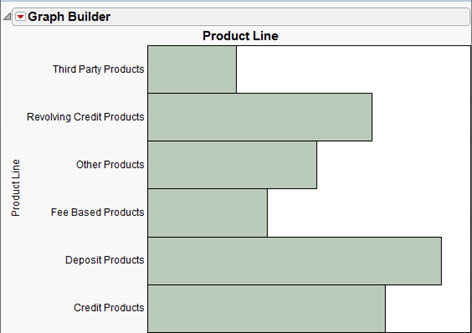
The initial graph will be ordered alphabetically (bottom-to-top). In order to re-order them, I first need to merge a continuous variable with the Y axis. Now this can be any continuous variable, even a column with random numbers. The only important factor is that it is continuous. Since I have a revenue column, I’ll use that one. The “merge” drop zone is just inside the graph next to the axis you want to merge with.
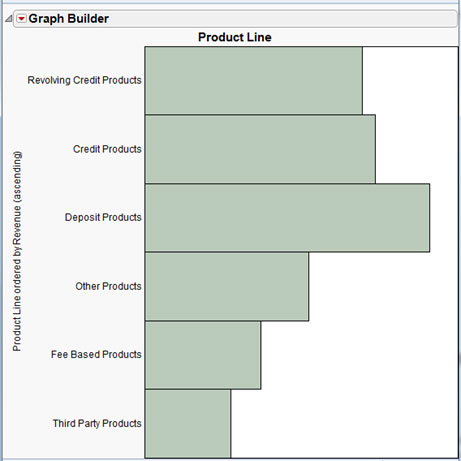
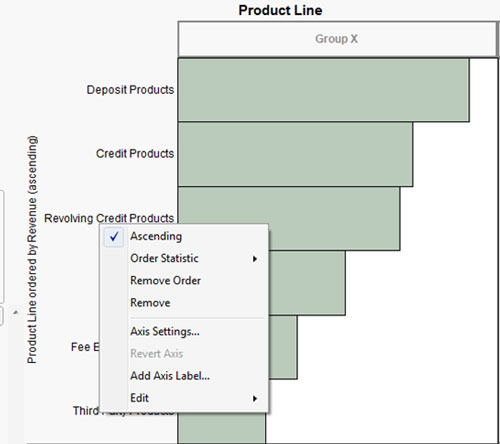
The default is for the data to be sorted by the mean of the continuous variable, in this case Revenue. In order to change it to the count of the records, you right-click on the Y axis and change the Order Statistic to N:
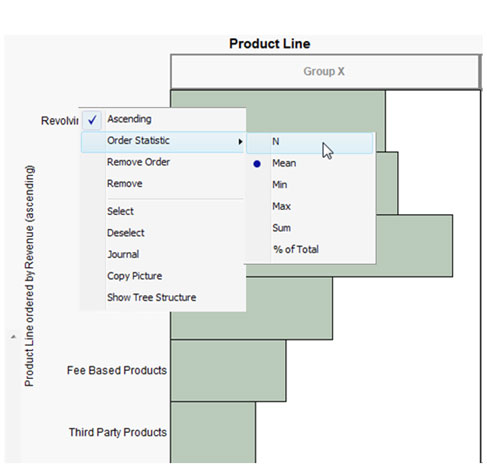
The graph will then be sorted by the number of rows in each category.
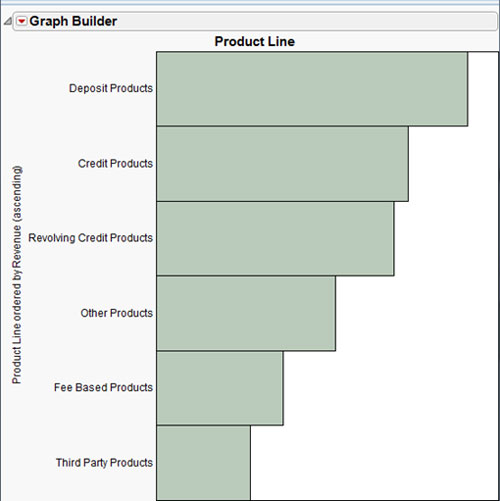
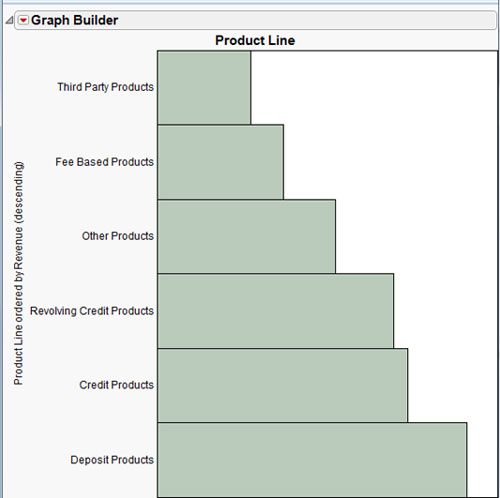
Right-click the Y axis a second time to flip the order (ascending to descending).
The same technique applies to any categorical axis or grouping in Graph Builder.


