Hello,
Does anybody know how to compare different processes using t-test in JMP?
I've seen reports such as the one shown below where defect levels from three different processes are shown in columns on the left of a report and the spreads are represented by bubbles on the right of the report.
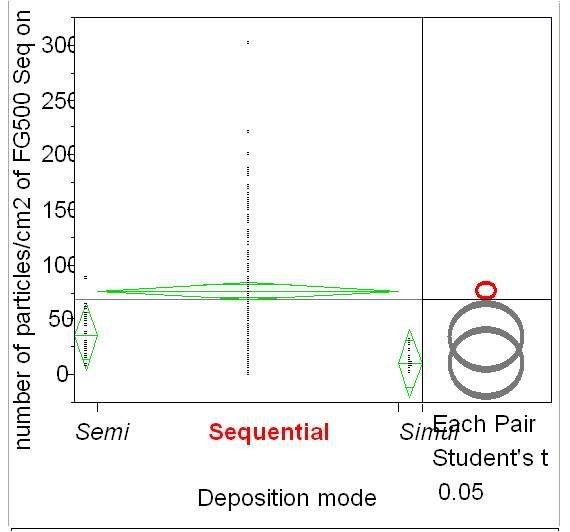
For any given process the data points are represented by a diamond showing upper quartile, median and lower quartile. The diameter of the bubbles on the right represent the standard deviation.
Bubbles that do not overlap indicate that the difference between the two processes being compared is statistically significant.
Thanks,
Sonu
