What is your JMP wish for the new year?
Log in to the Community to add your wish in a comment below.
"Like" the wishes from others that you want to see come true.
Re: What is your JMP wish for the new year?<meta http-equiv="Content-Type" content="text/html; charset=UTF-8" />I find sometime and learn how to automate all my modeling processes using the JMP Prp 12.2 Application Platform.
Re: What is your JMP wish for the new year?Sorry to reply to a 10 month old thread but I figured this was worth mentioning. I've noticed that there are formula functions that do not appear in the formula menus. If you can't find what you want in the formula menu, google the jsl equivalent, or look under help->books->scripting syntax reference and search.
Median would be: Quantile(0.5, arguments), where arguments are (per documentation) numbers, lists of numbers, or matrices. I suppose you would need to have table variables or globals to use this, or maybe several columns on a per row basis? Not sure, I never used it in a column formula, just in a script.
Column Median would be: col quantile(:column_name, 0.5).
Not sure if mode is supported.
Re: What is your JMP wish for the new year?Sorry for the late submission...
I wish JMP default color schemes to be the same between Graph Builder and other JMP platforms. Right now, they are different, which can cause confusing inconsistencies when presenting data.

Re: What is your JMP wish for the new year?Is it possible to create graphs to compare distributions?
A distribution chart gets below the flipped distribution of a reference population.
Proposal of chart for comparison of distributions for non-statisticans
.
Re: What is your JMP wish for the new year?Thanks for the kudos in #3.
25 years of JMP reports take a while to convert to HTML5, so we've been trying to support the most popular platforms first. Please help us prioritize by letting us know which platforms you would like us to work on first.
Thanks!
Re: What is your JMP wish for the new year?Please allow button boxes to have submenus, like outline boxes. The click area of button boxes is larger and therefore easier to use than clicking on the red triangle.
Re: What is your JMP wish for the new year?A few 'New Years' wishes, in descending order of importance:
1) Variability Chart should be under the Graph Menu, in addition to Quality Menu
[as it is extremely useful for viewing multiple factors simultaneously, in numerous contexts]
2) Multidimensional Scaling as a menu item under Multivariate Methods
3) Rapid conversion to HTML5 Format for all Platforms (kudos to all work done so far!)
4) Enhancing of Fit Model to allow for i) Robust Regression (e.g M estimation) and ii) LASSO/LARS approach
5) Development of a simple 1-pager on how to interface with R
Thanks sincerely for your time & consideration and ...
Happy New Year & wishing all there in Cary for a good 2015
Re: What is your JMP wish for the new year?Amen, Amen, Amen. Reporting the R-squared Predicted is LONG over due. It really is ludicrous for the JMP user to have to manually calculate this from PRESS and very time I do it I find it irritating. Please, please JMP developers, put this near the top of your improvement list! Thank you.
Re: What is your JMP wish for the new year?I would like the Fit Model platform to be able to generate Predicted R-Squared automatically. I find this just as useful as the 'standard' and adjusted R-squareds, and I'm fed up with having to calculate it manually from 1 - (PRESS / Total Sum of Squares)...
Re: What is your JMP wish for the new year?I would like to second this suggestion. In particular, the robustness aspect of the exported flash object of a prediction profiler plot is critical. Complex models from DOEs involving mixture and process factors (continuous, categorical, blocking, etc) can generate extremely useful prediction profile plots within JMP, but periodically the exported flash versions either do not work well or at all.\
A related request is perhaps some guidance on how to export the prediction profile plot confidence limits on predicted levels for either process average of multiple validation runs or for individual check points. My understanding is that some of the vector match required to calculate standard errors (Save Colulmns>StdErr Pred Formula within Fit Model) used to show prediction confidence limits on prediction profile plots can not be handled by flash objects so exported flash objects can not show such confidence limits. Is there a work around for this OR can a very close approximation of the StdErr Pred Formula be generated with mathematical functions that do work in flash objects. It would be FANTASTIC to be able to provide flash versions of prediction profile plots with prediction confidence limits (even if approximated) to remind recipients that models are not deterministic but rather are estimated with error and so confirmation or check point run results should be evaluted relative to their prediction confidence limits and not just to the predicted point estimate.
Re: What is your JMP wish for the new year?Mcstagger:
You asked about the ability to insert a column after the column currently selected. The following script will insert a numeric column after every currently selected column:
collist = current data table() << get selected columns;
For( i=1, i <= N Items( collist ), i++,
cdt << Add Multiple Columns( "Column", 1, after ( collist ), Numeric )
);
Copy these 4 lines to a new script window (File > New > Script) and save the script. If you're running on Windows you can make this script available on your toolbar by going to View > Customize > Menus and Toolbars, and creating a new toolbar with a toolbar button that runs this script.
Re: What is your JMP wish for the new year?I would like to export complex prediction formulas (saved in Fit Model) to Excel in such a way that I can easily provide a "what if" spreadsheet for customers/clients who do not use JMP. I recently generated polynomial prediction models for complex mixture-process experiments — some models containing more than 100 terms — and there was no easy way using JMP to move the resulting formulas to Excel. I'm also looking forward to an HTML export version of the Prediction Profiler that is robust for complex models.
Thanks!
Re: What is your JMP wish for the new year?I wish for the optional to be added for all Statistical Col functions. I think the option would be especially useful for Col Quantile (which does not yet have this option).

Re: What is your JMP wish for the new year?I wish for a Timeline Platform in JMP. Something to create graphs like this:

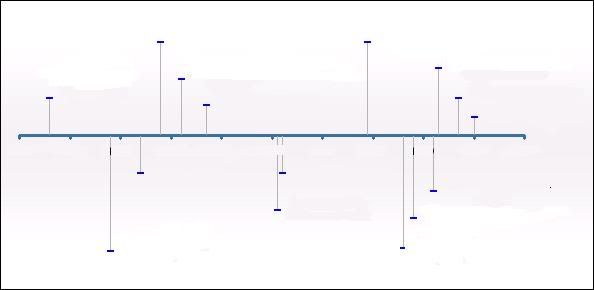
Re: What is your JMP wish for the new year?Yes,this would be great!
Re: What is your JMP wish for the new year?Once I have generated a report, I usually update the header to be more informative in the sense of good documentation. My wish is that this updated informative header should be automatically transferred when I save the script of the report e.g. to the data table and appear as the name of the script. Currently these scripts receive rather uninformative names like: Fit model. Fit model2 etc. My proposal would make the many scripts, which I usually save with a data table, better documented and searchable.
Re: What is your JMP wish for the new year?My wish for the new year is to add the option to remove the X labels from the Normal Quantile Plot. The X labels can distract from the data, especially when there are several X levels.

Re: What is your JMP wish for the new year?On the categorical platform (which I love, so I use it a lot), most people have a hard time understanding the Share Chart labels - they are confused about how they relate to the table. I don't know why, but it is so.
Wish 1: A way to make the Share Chart clearer to the initiated, so that I don't have to recreate the share charts in Graph Builder. Perhaps a legend rather than the labels in the chart?
Wish 2: That the Share Chart could be sorted from highest to lowest, or vice-versa, either by mean score or by the highest (or lowest) category.
Happy Holidays to all!
Re: What is your JMP wish for the new year?Dear Santa,
When I create a new formula column, could I please have a MODE and MEDIAN option? Means are great, but sometimes a median or mode would be useful. Column Mode and Column Median would be nice too.
Thanks so much.
Re: What is your JMP wish for the new year?I agree that "dumbing down" statistical approaches is not a good idea. But in my experience, there are some basic statistical things a data analyst should be able to use (by "data analyst" and I mean e.g. process engineers in an industrial environment, who have had appropriate training, but who are not statisticians or mathematicians). Even for them it's not easy to perform and interpret a simple t-test or an ANOVA in JMP. What if there would be a user guidance for some principal methods, and for the andvanced ones a hint like "please consult a statistician for correct application"? I mean, the big advantage of JMP compared with other statistical software is that it is so intuitive and easy to learn - at least concerning visualisation, preprocessing, DoE etc - why not also for some basic statistics?
Btw, p-values in italics could be a simple and nice first step 
Re: What is your JMP wish for the new year?hi smoore2,

Re: What is your JMP wish for the new year?I like some parts of this idea while I also struggle with the idea that there are some methods that I don't want to see too "dumbed down". What about having p-values represented as a different font? Say Italics? This could be a simple check box in the preferences that users could turn on.
Re: What is your JMP wish for the new year?... and another one 
we'd like an additional option in scatterplots (fit Y by X, graph builder etc.) to show error bars (vertical & horizontal) at every data point. The length of error bars might be constant for all points, a percentage or a value from a third data column - see error indicator in Excel...
Re: What is your JMP wish for the new year?... two more wishes from our users:
1. In a range check of a column the values out of the chosen range are deleted. Would it be possible to exclude/hide them for this single column, without excluding/hiding the whole row?
2. To save several analyses simultaneously to a data table it would be nice to have an option "save all scripts to data table/script window" instead of clicking "save script to data table/script window" for every single analysis
Re: What is your JMP wish for the new year?It would be great if there were a kind of user guidance during statistical analyses: what hypothesis is to test, which test should be chosen, what do you have to check before (normal distribution...?), what significance level do you want etc. Moreover, the output should be more comprehensible for non-statisticians. (at least, every p-value should be marked by "p-value" - better would be a phrase telling about the test result / significance etc.).
I think in our company there would be many more JMP users if analyses like these could be done more easily...
Re: What is your JMP wish for the new year?Most of my wish list items relate to DOE functionality which I use more heavily than other capabilities. Some specific requests.
- Prediction profile plots are great but a practical limitation on number of Ys when capturing JMP results in MS Office application reports may mean having multiple Fit Model windows or Profiler windows open. Would be very nice to be able to link selected windows together so that optimization in one window would propagate to profilers in linked windows.
- A more flexibile implementation of Y transformations in Fit Model platform. For example would be nice to request a Box Cox tranformation for a specific power (perhaps after determining the optimal lambda from Box transformation option within factor profiling menu). Ideally this would be implemented at Fit Model menu and user could be prompted for not only desired lambda but also whether to add a constant to raw Y data prior to power tranformation. When DOE data has one or more zero values adding a constant is necessary prior to investigating powers. Fit model window output should handle all transformations and back transformations so that user does not have to do the mental gymnastics for back transformations in selected graphs like the prediction profiler.
- DOE Custom Designer window should behave like other JMP windows were hovering the pointer over the active below title bar will activate menus. Also quick keys for cursor roles like S for Selection, L for Lasso, etc should behave just like other JMP windows.
all for now. may add more wish list items later. Thanks for your consideration!
Re: What is your JMP wish for the new year?Something very simple: the ability to change the font size of axis titles through a simple dialog box!
Also the ability to make gridlines the same colour as a graph's background, but sitting in front of data, such that they are only visible when they cut over data.
Re: What is your JMP wish for the new year?In the Sort dialog, there is a Replace Table checkbox under the column selector on the left that should let you sort your table and replace the existing one instead of creating a new one. I'm not sure in what version that option was added, though.
Re: What is your JMP wish for the new year?I would like the graph builder elves to make the "outlier" box be magically unchecked when I have both points and box plots on a graph so I don't get double the outliers that I don't notice until I have moved my graph to my document saving me from returning to uncheck and cut and paste again.
Re: What is your JMP wish for the new year?Dear Santa,
I wish that Robust Means and Robust Standard Deviations were available as functions in the Formula Editor.
Thank you in advance for granting this humble request.
p.s. ...also in the Summary platform.
Re: What is your JMP wish for the new year?Thought of another one!
Could you make it so that the Log window is dockable in the home screen in a manner similar to the projects list, etc.?
Re: What is your JMP wish for the new year?Thanks for this comment.
Anyhow a visualization rather than a data table would be fine for getting an overview what to look for.
Re: What is your JMP wish for the new year?It would be great to have a panic button in JMP like the "interrupt" in SAS! Sometimes I apply a column formula to a large table or start modeling, and the systems just freezes during calculation. There is no option to stop it other then exit the entire programm.
Re: What is your JMP wish for the new year?My #1 wish is that JMP stability improve. It crashes for me sometimes when I resize windows, select items in a platform, just randomly... I've never used a professionally written program that crashes anywhere near as often as this one. Very frustrating, and responsible for hours of lost work probably every week.
Re: What is your JMP wish for the new year?You won’t get a new datatable if there are no platforms created with the original one. Do your sorting first, then build the platform.
Re: What is your JMP wish for the new year?Have you utilized the Tables>Missing Data Pattern and run the Treemap script?
Re: What is your JMP wish for the new year?A zoom for table views would enable to get an overview of data quality. In a large table there could be hidden that too many values are missing for a reliable statistic.
Today I export often to EXCEL and tuen zoom ti 10% or 25% to see the table as a whole and find the gaps.
Then I can decide if the missing data jeopardizes reliable results.
Re: What is your JMP wish for the new year?A good addition would be the ability to highlight all instances of a variable in a script when you double click on one instance. Similar to the feature Notepad++. When your scripts delve into the thousandth line it gets pretty cumbersome trying to find the inital initiation of a specific variabe. Yes, I know Ctrl+F exists but being able to scroll to see all instances can be pretty helpful while debugging!
Re: What is your JMP wish for the new year?Two wishes:
1. Would like to have a variable viewer in the script editor similar to what is in the debugger.
2. A "graph builder" for spectroscopic or x-ray diffraction type data that would allow fitting of multiple gaussian, lorentzian, etc... peaks.
Thanks!
Re: What is your JMP wish for the new year?Would like to build control charts with seasonal data - see Wheeler's published dicussion on how to do this.
Re: What is your JMP wish for the new year?There are times when I do NOT want a new data table, like when I sort the data using a certain column. There should be an option as to whether you want a new table or not.
Re: What is your JMP wish for the new year?I write scripts that are executed both in Europe AND the US of A. The problem is that the decimal sign is different, which means I have to add an input parameter defining the decimal sign. To solve this I have to spent hours of writing code to get around this.
P L E A S E, make it so that there is an expression to set the decimal sign default on a point or comma, from which on the script uses a point or a comma from that point on (until defined otherwise). Something like
Set Decimal Point ( 1 );
Thank you!
Jan
Re: What is your JMP wish for the new year?I'd love to see a history of my work presented in a mind map format. If I open a table, it shows up in a mind map. If I create a graph from that table, a link to that graph explaining the parameters used shows up. If I create another graph, a parallel link shows up. Sub table, another parallel link. Then links from that sub table to anything built from it.
Re: What is your JMP wish for the new year?....I also wish there was a user friendly way to add spec limits by group for the variability charts. This can only be done now with some graphics scripting.
Re: What is your JMP wish for the new year?I wish the Measurement Systems Analysis was more capable, flexible and the platform output was easier to comprehend. I get more complaints about this platform than any other; most people in my office will just take the variance components and copy them into Excel to complete the analysis there.
Re: What is your JMP wish for the new year?In the graph builder, I would like to be able to easily include sample size, and perhaps results of post hoc tests to ANOVA-style results (e.g. the connecting letters from Tukey test, above the boxplots or columns) - perhaps it is already possible, but I haven't found it yet...
Re: What is your JMP wish for the new year?You can actually already do that, by clicking Col-->Add multiple columns, and then select 1 column to insert, after the column currently selected. A bit counterintuitive, but it works
Edit: oops, didn't see but the question was already answered...
Re: What is your JMP wish for the new year?Ah! I was not aware of that little tidbit. I will definitely try that out. Thank you!
Re: What is your JMP wish for the new year?Agreed the lots of columns are hard to deal with. I use column grouping to help manage such tables. However, If a column is selected and you used the "add multiple columns" it will automatically assume you want to insert your column(s) after the selected column.
Re: What is your JMP wish for the new year?I want to wish the developers a wonderful holiday season and to thank them for taking the time to not only listen to our wishes but to work to grant our wishes!
Re: What is your JMP wish for the new year?Eh, kind of a non-solution if you have thousands of variables with fairly nondescript names. You then have to scroll your brains out trying to locate the exact location where you want the column to go. It's a painful process if you need to add in a bunch of columns in different locations.
That said, that is what I have been using since the base add column command in conjunction with the move column command is even more painful to deal with.
Re: What is your JMP wish for the new year?Your first wish is granted only you have to be sneaky and use the "add multiple columns", I know, you only want to add one but if you use the multiple option you can select the location of where you want to insert your one column.
Re: What is your JMP wish for the new year?Paul, loops and other order dependent shapes are possible in Overlay Plot if the Sort X option is not checked. (like the "Row Order" option in Graph Builder).
Run the code below with and without Sort X( 0 ) to see the difference:
New Table( "Tree",
Add Rows( 21 ),
New Column( "X",
Set Selected,
Set Values([10, 8, 8, 2, 6, 4, 8, 6, 10, 14, 12, 16, 14, 18, 12, 12, 10, 9, 10, 11, 8])),
New Column( "Y",
Set Values([0, 0, 5, 5, 8, 8, 13, 13, 18, 13, 13, 8, 8, 5, 5, 0, 0, ., ., ., .])),
New Column( "Y2",
Set Values([., ., ., ., ., ., 21, ., ., ., 20, ., ., ., ., ., ., 23, 18, 23, 21]))
)<<Overlay Plot(
X( :X ),
Y( :Y, :Y2 ),
Sort X( 0 ),
Connect Thru Missing( 1 ),
:Y( Connect Color( 52 ) ),
:Y2( Connect Color( 41 ) )
);
I have a related wish, though. An option for Graph Builder's Line graph, like in Overlay Plot, to "Connect Thru Missing" when Row Order is Checked. That would facilitate gap-less plotting of vertical profiles which typically in aquatic, atmospheric and soil sciences keep the y-axis reserved for depth/height and the x-axis for observed variables, which may be measured at different vertical resolution.
Re: What is your JMP wish for the new year?Would love to have a native quantile regression fitting algorithm within JMP. There is one through a SAS connection but not very convenient. Should be easy to include, no?
Re: What is your JMP wish for the new year?Just great! But you have to leave something for Santa ….
Re: What is your JMP wish for the new year?I'd like to see MDS (Multidimensional Scaling). There used to be a R addin for it, but now it's gone. Please bring it back!
Re: What is your JMP wish for the new year?Glad to hear that, Anja, because quantile-based gradient coloring is coming in JMP 12.
Re: What is your JMP wish for the new year?Creating a network graph would be a wonderful addition to JMP.
Re: What is your JMP wish for the new year?It would be most useful if there were a tool, similar to the one available for SAS users, that facilitated ingestion of XML data without having to write JSL.
Re: What is your JMP wish for the new year?It would be nice if JMP could connect the dots on an overlay plot in a sequence defined by numbers in a column. Presently if you have a hysteresis loop to plot you have to break the plot into sequential chunks and plot each of them to get a loop.
Re: What is your JMP wish for the new year?The ability to insert a column after the column currently selected would be nice.
Also, being able to search for variables in all windows in which variables are shown. It would also be nice to see long names in all variable windows as well.
Re: What is your JMP wish for the new year?I wish that the Tabulate feature didn't change the "N" decimal places when I do a Change Format, use same decimal format, and set the rest of my table to one or two decimal places. Is there even an instance where I need to tell someone that my N is 149.00?
Re: What is your JMP wish for the new year?Hi all,
this is a wonderful idea, and I would like to post a "Graph Builder" wish related to the coloring of measures.
In the "Gradient Setting" I often have to change the default minimum + center + maximum setting to the 10% quantile + median + 90% quantile (I copy them from "distribution") to see more color-differentiation and better visualization of my data. This is not too bad - if I'm not working with local data filters with different quantiles ...
It would be just great to have the option to insert the quantile-percentages in alternative to the absolute values - or, even better, to switch entirely according to my "general settings".
All the best and a very good start in 2015,
Anja (anja.simon@dlh.de)
