Presently trying to manually set the control limits in Levey Jennings control chart since my data has a natural limit of LCL = 0. Can you please suggest how can I do it in JMP Pro 12?
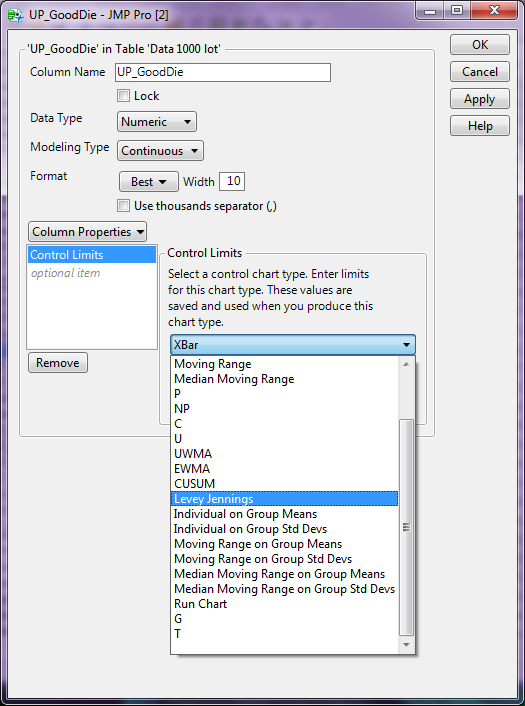
right mouse click on the column of interest and select
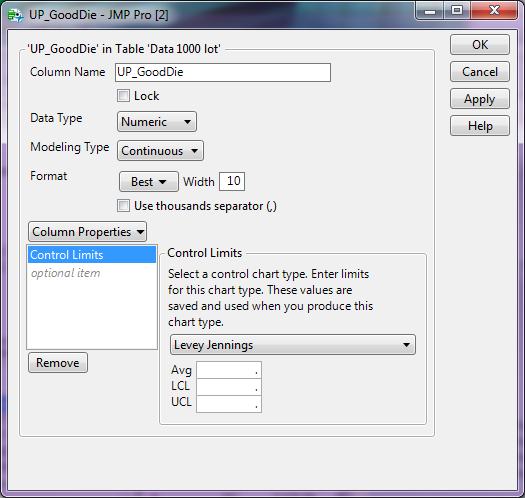
Column Properties==>Control Limits
Then select Levey Jennings
and then set your LCL
Hi Jim,
Thank you for the solution
I have selected the CL, LCL and UCL columns and put in the following information as you have mentioned above
CL = 28907525.70
LCL = 0
UCL = 3648261306.71
But when I am clicking on Analyze<Quality and Process<Control Chart<Levey Jennings Control chart it is not taking my set limits. Can you please tell me where I am going wrong?
Is it possible that you set the UCL and LCL for XBar, or C Chart, etc. rather than for the Levey Jennings? I used the Semiconductor Capability data table from the Sample data tables, and set the Levey Jennings LCL to 0 and the UCL to 120 and then ran the Control Chart platform for Levey Jennings, and got the following results:
What if your limits keep changing and climbing with each point? An example could be rheometer data; hydration vs. time. I need to set my limits using a column of data for both upper and lower. thanks!
You can use a phase variable and a limits data table. Details can be found in the following blog post.
https://community.jmp.com/t5/JMPer-Cable/4-ways-to-use-fixed-baseline-historical-control-limits-in/ba-p/33223