How do I do a combination bar and line plot using Overlay Plot?<meta http-equiv="Content-Type" content="text/html; charset=UTF-8" />Using JMP 12. I want to change the options for the two y axes independently of each other such that one of them has a bar plot and the other has a line plot. I don't want to do this with Graph Builder because the output is too cumbersome for my combination of graphs. There must be a way to do this because I can see it in the examples on this page:
Overlay Plots
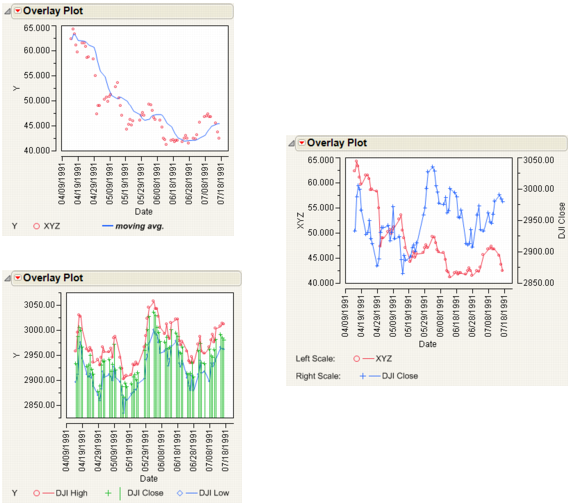
How do I independently select which series get points connected and which has the needle?
Thanks!
Re: How do I do a combination bar and line plot using Overlay Plot?That does it. Thanks!
Re: How do I do a combination bar and line plot using Overlay Plot?Scott, in this example you can select the overlay marker, connect color, line style, and other graph options for each variable (Y) after you create the overlay plot. You can do this directly from the legend. Left click on the variable in the legend (in the bottom picture, you would select DJI Close) and it becomes highlighted. Then right click to bring up options for the highlighted variable (in the bottom picture, when DJI Close is selected, you would select needle).
