Using JMP 12. I want to change the options for the two y axes independently of each other such that one of them has a bar plot and the other has a line plot. I don't want to do this with Graph Builder because the output is too cumbersome for my combination of graphs. There must be a way to do this because I can see it in the examples on this page:
Overlay Plots
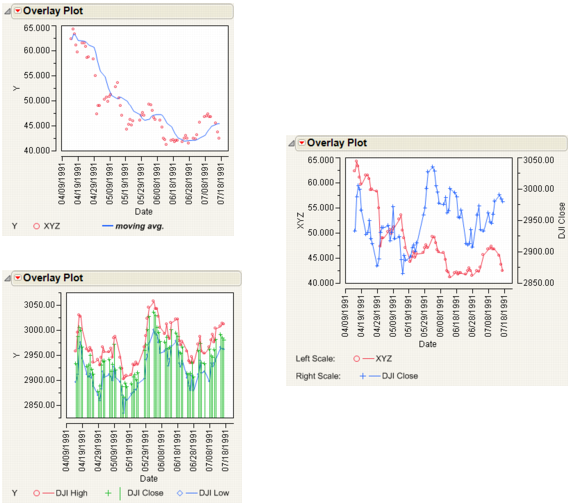
How do I independently select which series get points connected and which has the needle?
Thanks!

