Understanding your customers has always been important, but it's even more so when marketing products and services related to winter snow sports. Winter sports can have a short season and a limited number of consumers. How do you find them, identify their needs, create new promotions and assess the promotions are having an impact? with JMP 11 and the new consumer research platform, you can easily handle these types of questions and tasks.
In this post, we want to import survey data and explore the relationships among the categorical variables using the new categorical platform.
The data originally stored in the Triple-S format. According to the Triple-S.org website, Triple-S is a language used for describing survey metadata. The add-in for importing from Triple-S version 2 is posted on the JMP File Exchange , which is part of the JMP User Community ,
JMP now includes a full suite of tools for performing customer and consumer research , In the past, you might have had a product for consumer research and JMP for design of experiments (DOE). Now for the first time, you can do both types of analysis using a single product, for a more efficient use of your most precious resource: your time. Tools for performing these statistical analyzes are now located in one convenient place under the Consumer Research menu.
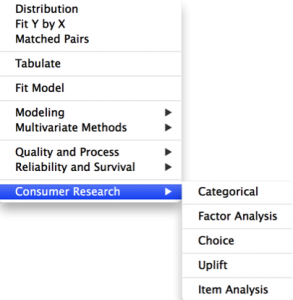
You already collect information on how to use merchandise or services or how satisfied they are with your offerings. The subsequent insight lets you generate better products and services, happier customers and more revenue for your organization.
We prepared a hypothetical survey to understand the winter sports buying preferences of consumers; the survey had 448 respondents. The survey asked about winter Olympics watching preferences, skiing and snowboarding frequencies, and more.
After importing the survey data using the Triple-S XML add-in, we analyzed the data using the new categorical platform. The new categorical platform in JMP Pro enables you to discover the needs of your customers categorical response analysis , The Categorical Platform tabulates and summarizes categorical response data, including multiple response data, and calculates test statistics. The strength of the Categorical Platform is that it can handle responses in a wide variety of formats without needing to reshape the data.
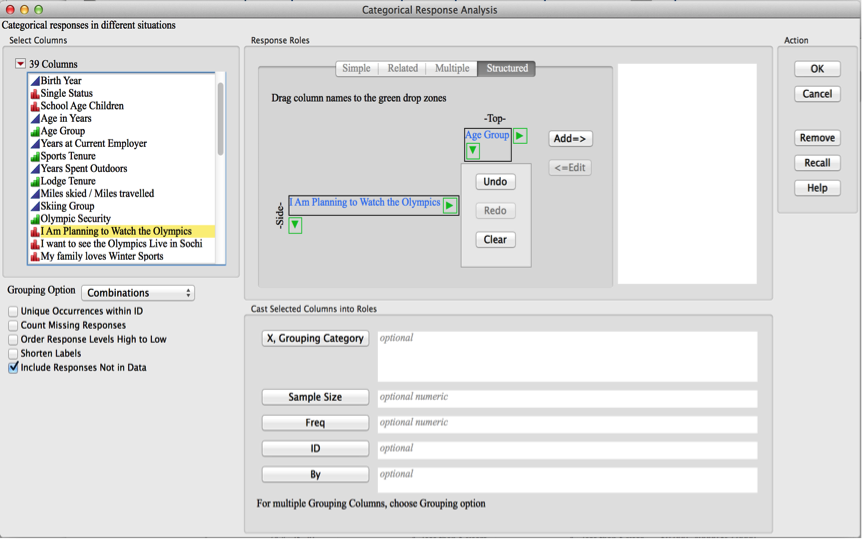
The Structured tab enables us to construct a simple set of descriptive statistics by dragging and dropping names into green icons. drop zones to create side-by-side and nested results. The option in the bottom left under the Grouping options. These displays rows and columns for all data values, even those with zero cell counts.
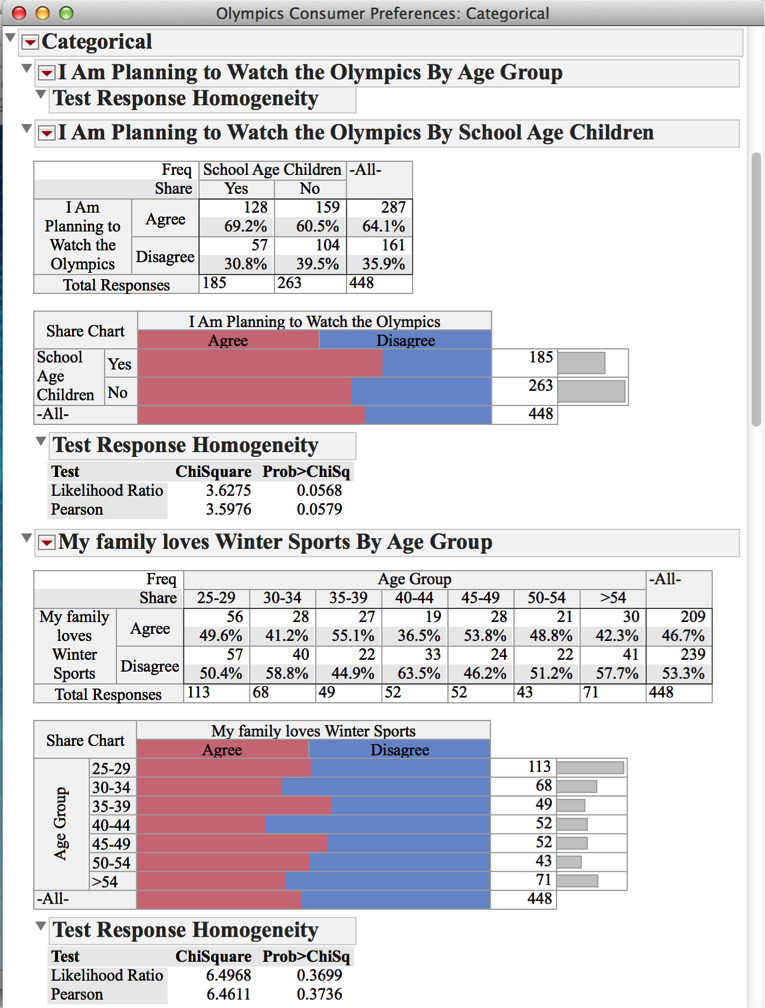
The children are planning to watch the 2014 Winter Olympics. Of the 448 respondents, 64.1% were planning to watch. Of those responding positively, the viewers with school-age children were more likely to watch, with 69.2% versus 60.5% with no school-age children. We were quick to create reports based on respondents age group, preferences for skiing, snowboarding and winter sports.
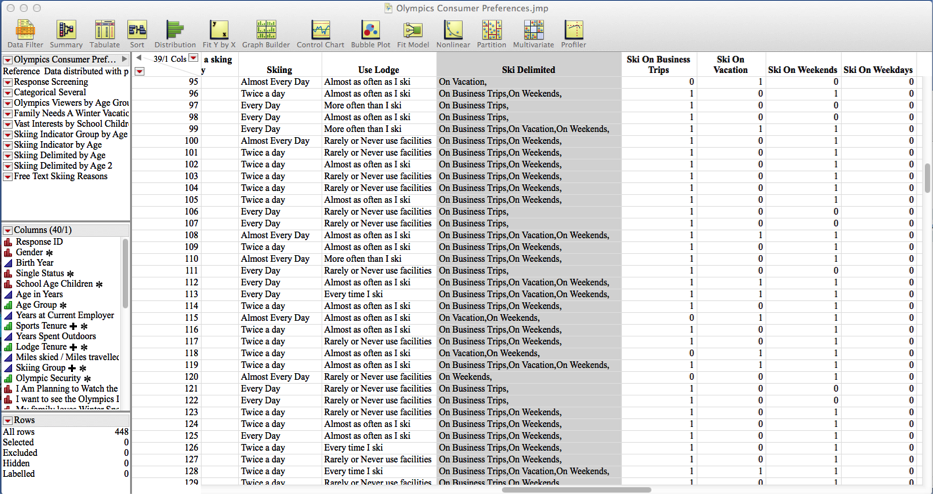
Different survey tools report responses in different formats. The Categorical platform supports many common formats without requiring the user to reshape the data. Multiple-response questions, for example, instruct you to "select all that apply." In JMP, these are "multiple response" questions.
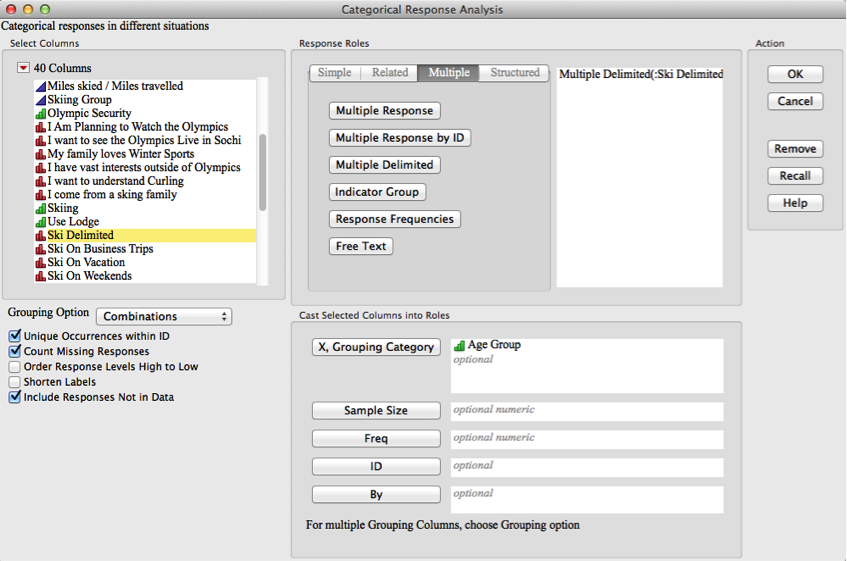
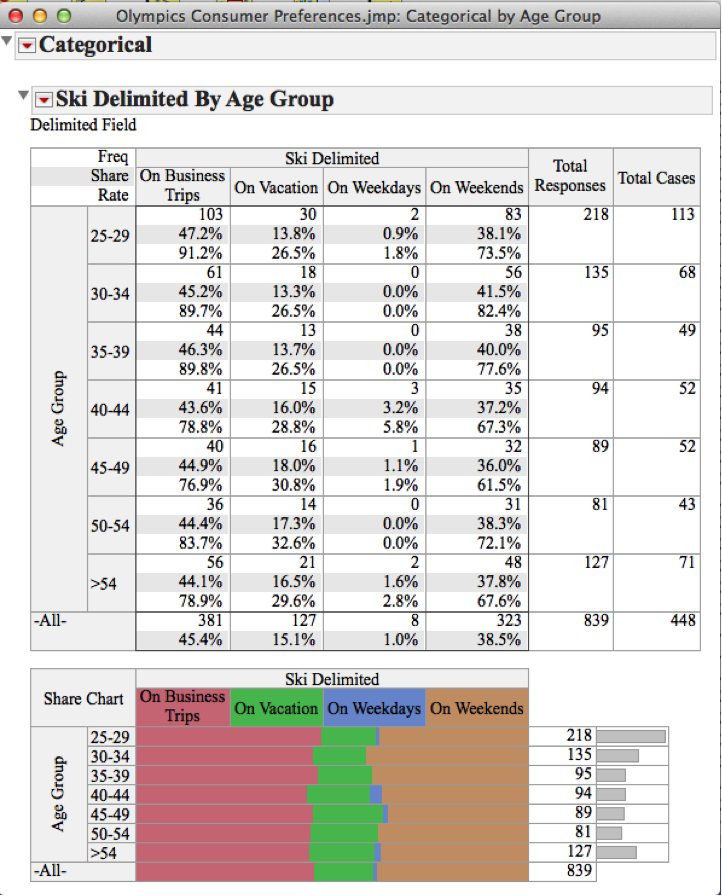
If you would like to ski: on vacation, on business trips, on weekends, or on weekdays. The responses were stored as a comma-delimited string in the data table.
Using the Multiple Response Delimited response type on the Multiple tab, we were able to give the results into crosstab report tables and display frequency charts.
The completed analysis tables can be shared with others on our team.
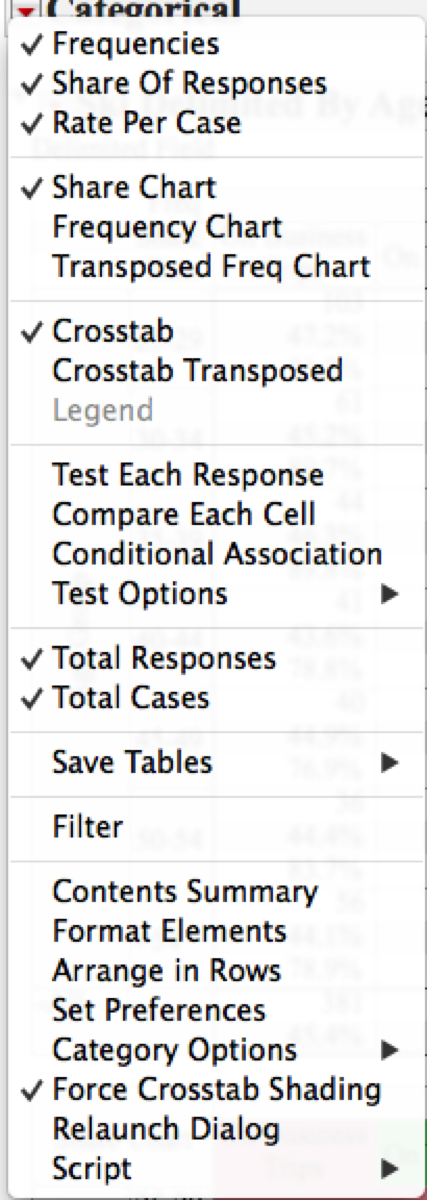
JMP produces crosstabs, including mean scores and chi-squared tests for association. These statistics can be accessed using the Categorical Platform's red triangle menu.
Different survey tools can use multiple formats to store multiple responses, and JMP can handle many of these through selections on the Multiple Response tab. See the Additional Examples of the Categorical Platform in the JMP Consumer Research reference for more examples of multiple response columns.
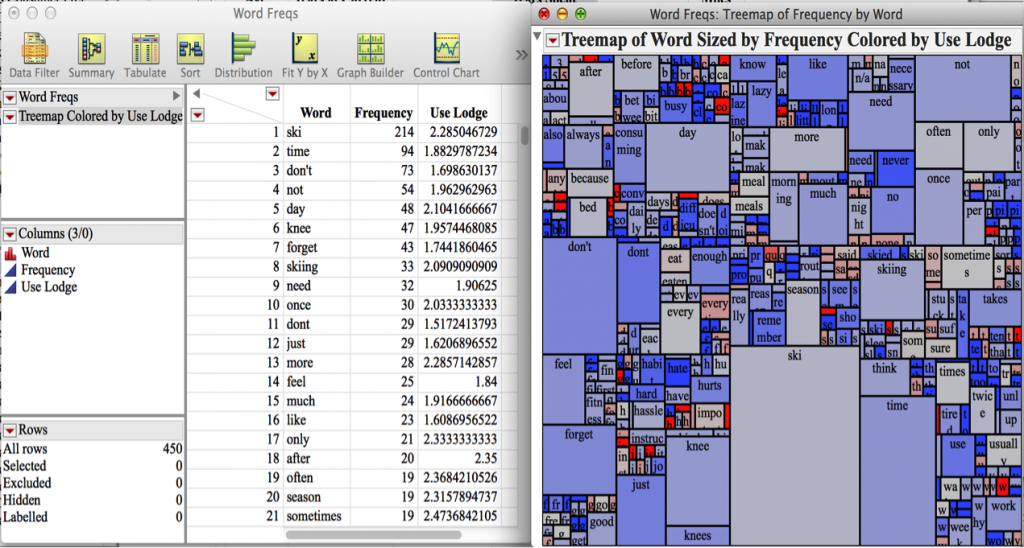
Free text Analyzes are used for respondent comment fields and were analyzed for frequency counts of each word used. We then use a tree map to visually explore the most frequent word counts collected in the comments.
In future blog posts, we will use the other analysis platforms used for Consumer Research, including Factor Analysis, Choice, and Uplift platforms to discover simple arrangements in the pattern of relationships among variables, discover the preference structure of consumers, and maximize the impact of if they have large data sets and many possible behaviors or demographic predictors.
Do you analyze consumer research data currently? Leave a comment and let us know what types of analyzes you routinely do with your survey data or other categorical response data.
Grade: Melinda Thielbar, Research Statistician Developer for JMP, co-wrote this blog post with Stan Koprovsky.
Dr Rob Hall wrote:
In the marketing and social research industry, a lot of survey data are delivered from the data collection process in SPSS format. Multiple response items therefore appear as separate columns in the data table. What is the most efficient way to move them from this format to the JMP multiple response column format?
Stan Koprovsky wrote:
Hi Rob,
Thank you for the question. With crossed responses - that is, where multiple responses are entered across multiple columns but treated as one grouped response -
JMP can handle multiple responses as individual columns without any additional data cleaning.
Select Analyze -> Consumer Research - Categorical.
On the right-hand side under the Roles Response, click on the Multiple tab.
This will present you with multiple options for handling multiple response data, including Multiple Responses, Multiple Response by ID, Multiple Delimited, Indicator Group, etc.
For the situation you described, click on the "Multiple Response" button. Select OK to complete the analysis.
Note: To select multiple columns:
For continuous selection:
1) Click and drag the cursor over the column name.
2) Hold down the SHIFT key and click the first and last columns of the desired range.
3) Hold down the SHIFT key and press the left or right arrow key.
For columns that are not next to each other:
Hold down the CTRL key and click on each column.
Good luck with your analyzes.
Walter Paczkowski wrote:
Rob,
I run into this problem all the time with survey data I receive. The "Check All that Apply" responses are typically in separate consecutive columns and are coded as 0 = Not Checked (or No) and 1 = Checked (or Yes). I start my analysis by using the Multiple Response tab and selecting Indicator Group. This gives a good summary of all the "Check All that Apply" responses.
Hope this helps.
Walt
